All investment exchanges are designed to separate you from your money.
Your broker is not your friend.
There are only two types of traders.
I am a Retail Trader.
I have never been a Professional Trader.
I think you should understand the difference between them.
♦ ----------------------------------------------- ♦
I have never been a Professional Trader.
♦ ----------------------------------------------- ♦
It's like De`ja' Vu all over again...
The events described on this blog continually repeat and can be seen on charts of any time frame or market.Presented are ideas, explanations and definitions of the Price/Action events I have used for years.
Apply these ideas for initiating long positions.
These techniques can be used for scalping, swing trading or investing.
I offer simple methodologies to take advantage of recurring patterns and signals.
My main focus is "how to" scalp bits and pieces of price reversals at bottoms.
"Trade with the established trend...Picking bottoms is a fool's game"
Conventional wisdom suggests that this idea is the only 'truth' needed
to be consistently successful at this game. Embracing the conventional wisdom
may seem to be the most logical and the surest way to approach the markets...
BUT
Since most traders are not very successful at this vocation
how valuable can the conventional wisdom be?
how valuable can the conventional wisdom be?
♦♦♦♦♦ ♦♦♦♦♦ ♦♦♦♦♦ ♦♦♦♦♦
I. REVERSALS RULE !
Section 1 of 6 -- Some basic concepts - P/A + Divergence
Section 1 of 6 -- Some basic concepts - P/A + Divergence
♦ ♦ ♦ ♦ ♦ ♦ ♦ ♦ ♦
My personal Technical Analysis bias is always pointing out bullish patterns...
Just call me a perma-bull - This chart link shows a major reason why I am.
Repeating patterns print on ALL time frames - Monthly, daily or intra-day charts.
I see bullish reversals as a matter of course. My basic premise is:
In the markets, what goes down must go up.
YM Chart - 75 ticks per bar spanning about 3 1/2 hours of the early morning price action.

The chart above is an example of what I mean by Price Action.
Price action is a way to describe what HAS HAPPENED and what IS HAPPENING in any market.
It can be used to extrapolate what MAY HAPPEN to price going forward into the future.

The chart above is an example of what I mean by Price Action.
Price action is a way to describe what HAS HAPPENED and what IS HAPPENING in any market.
It can be used to extrapolate what MAY HAPPEN to price going forward into the future.
Price Action: a very basic tool that can help verify a new direction
AFTER a trend has REVERSED
The chart below illustrates what I mean by Divergence.
I define it as follows: price going in one direction while indicators do the opposite.
The yellow box shows price making a lower low while the indicators make higher lows.
The chart below illustrates what I mean by Divergence.
I define it as follows: price going in one direction while indicators do the opposite.
The yellow box shows price making a lower low while the indicators make higher lows.
Price-to-indicator divergence: a common pattern that occurs
BEFORE price REVERSES
Divergence is a very useful tool for technical traders.
ES Chart - 12 minutes per bar spanning two 24 hour sessions.

Hunting for REVERSAL patterns
I have observed that price seems to do more oscillating ↓→↑→↓→↑ (link) than trending even
when it can be seen to be moving in one over-all direction for an extended period of time.
when it can be seen to be moving in one over-all direction for an extended period of time.
I have developed trade methods to take advantage of very short term price oscillations.
These methods work whether the long term or over-all trend is down or up.
These methods work whether the long term or over-all trend is down or up.
My methodologies are applicable for trading long
page for a way
to get around this limitation using Bull/Bear ETFs.
Applying my methods (or an inverse of them) for taking short trades
Most of the examples on this blog are showing tick based e-mini Futures charts.
The methods, patterns and signals I present work just as well
when using time based charts and for trading stocks or ETFs.
♦♦♦♦♦ ♦♦♦♦♦ ♦♦♦♦♦ ♦♦♦♦♦
II. REVERSALS RULE !
Section 2 of 6 -- Chart Patterns and Signals
♦ ♦ ♦ ♦ ♦ ♦ ♦ ♦ ♦
♦♦♦♦♦ ♦♦♦♦♦ ♦♦♦♦♦ ♦♦♦♦♦
II. REVERSALS RULE !
Section 2 of 6 -- Chart Patterns and Signals
♦ ♦ ♦ ♦ ♦ ♦ ♦ ♦ ♦
"Typical" Price Action patterns and signals
Divergences often print before prices change direction...they form BEFORE price REVERSES..
They are reliable signals that alert a trader of an impeding re-direction of prices
and provide excellent entry points for front running potential new up trends.

They are reliable signals that alert a trader of an impeding re-direction of prices
and provide excellent entry points for front running potential new up trends.

"Typical" REVERSAL patterns
documented on TIME and TICK based charts. The red arrows on the left
describe bearish price action, typical of down trends. The green arrows
high-light the bullish price action that followed, typical of up trends.
The colored triangles point out price-to-indicator divergences.
RLM Chart - 3 minutes per bar spanning about 6 hours

They are a time lapse set of the same Price Action, same Trend Lines and same Indicator signals.
(Click on the chart for a larger view in 'slideshow' mode)
RLM Charts - 75 ticks per bar spanning between 1 to 2 hours

What goes down must go up...In up trends or in down trends
Link to a REVERSAL in a "relentless" down trend...A REVERSAL on multiple time frames...
A REVERSAL in the early morning...
LONG trades in a down trend
H&S suggests a down trend beginning
Heavy session selling but LONG trades will still be presented
Don't be put off by the 'busy-ness' of the charts included on this blog...most of the annotations
were added after the snapshots were taken. I draw a lot of trend lines on my trading charts
throughout the day but I do not add the notations shown when trading.
throughout the day but I do not add the notations shown when trading.
♦♦♦♦♦ ♦♦♦♦♦ ♦♦♦♦♦ ♦♦♦♦♦
III. REVERSALS RULE !
Section 3 of 6 -- Typical Examples
♦ ♦ ♦ ♦ ♦ ♦ ♦ ♦ ♦
♦♦♦♦♦ ♦♦♦♦♦ ♦♦♦♦♦ ♦♦♦♦♦
III. REVERSALS RULE !
Section 3 of 6 -- Typical Examples
♦ ♦ ♦ ♦ ♦ ♦ ♦ ♦ ♦
How I do It
The following six example charts present an overview of the recurring events that are discussed throughout this blog... i.e. repeating patterns. My intention is to explain how to take advantage of them via trading, day in day out...
Explanations of the terms and abbreviations used on the charts are posted here:
Example 1...First and foremost: Price Action
RLM Chart - 45 ticks per bar spanning less than 15 minutes
Example 2...Trend Lines define the Price Action
RLM Chart - 45 ticks per bar spanning less than 2 hours

Example 3...P/A Patterns and Indicator Signals
YM Chart - 120 ticks per bar spanning 2 1/2 hours

Example 4...Putting it all together
YM Chart - 90 ticks per bar spanning about 30 minutes

Example 5...Continue to watch Price Action
Very often you can "miss" acting on signals that are generated on the charts.
When it happens, DO NOT chase prices -- let price return to you.
RLM Chart - 30 ticks per bar spanning about 30 minutes

Example 6...Multiple time frames enhance perspective
YM Charts - 60 and 30 ticks per bar spanning less than 1/2 hours

In its simplest form, my method uses Price Action and Trend Lines to identify price reversals :
...Bullish directional changes - from down to up...
The price patterns on the charts may all look the same but note that they are showing different markets
with different time frames and were all 'snapped' on different days at different times of the day.
These types of patterns happen many, many times every day... AND they have been happening
ever since price charts were invented. Thus my premise as stated above:
...In the markets, what goes down must go up...
♦♦♦♦♦ ♦♦♦♦♦ ♦♦♦♦♦ ♦♦♦♦♦
IV. REVERSALS RULE !
Section 4 of 6 -- Initial Caveats
♦ ♦ ♦ ♦ ♦ ♦ ♦ ♦ ♦
♦♦♦♦♦ ♦♦♦♦♦ ♦♦♦♦♦ ♦♦♦♦♦
IV. REVERSALS RULE !
Section 4 of 6 -- Initial Caveats
♦ ♦ ♦ ♦ ♦ ♦ ♦ ♦ ♦
If you are excited about the possibilities that easily recognizable, repeating patterns may present
that's good...but don't let your initial excitement go too far...
It's not always as easy as it looks
There will be days when you'll see no signals, conflicting signals, or nothing but poor signals ...Or days with good signals that fail resulting in nothing but stop-outs on the trades you take.
...The best laid plans of mice and men...
Also be aware that reversals can happen at any time
without advanced warning from patterns or indicators.
I suggest you find a way to temper your initial excitement
and direct your trading with the above caveats in mind.


What I do is simple and repetitive :
It gets very boring watching squiggly lines on a chart all day !
If you are able to get through this "Home page" and are interested in learning more about all the stuff I've posted I recommend studying the pages that are listed on the right hand side. The pages are numbered by what I consider to be their level of importance to the learning curve.
At this point, I want to stress the absolute necessity of keeping accurate trading records & statistics. Understand their implications to your trading bottom line. I realize that this part of "trading for a living"
can be the most tedious part of the entire business.
But neglecting this aspect will prevent you from excelling at this vocation.
can be the most tedious part of the entire business.
But neglecting this aspect will prevent you from excelling at this vocation.
Some of the reasons "why they are important" are listed on the page linked below:
---Ignoring your statistics will lead you to ruin---
♦♦♦♦♦ ♦♦♦♦♦ ♦♦♦♦♦ ♦♦♦♦♦
V. REVERSALS RULE !
Section 5 of 6 -- Why I Created this Blog
♦ ♦ ♦ ♦ ♦ ♦ ♦ ♦ ♦
♦♦♦♦♦ ♦♦♦♦♦ ♦♦♦♦♦ ♦♦♦♦♦
V. REVERSALS RULE !
Section 5 of 6 -- Why I Created this Blog
♦ ♦ ♦ ♦ ♦ ♦ ♦ ♦ ♦
This blog is primarily for my benefit. I created it to keep myself focused on what I love doing, trading for a living. It is my Trader's Log, my Blog-Log if you will. I hope the reader can gain some insights to add to his personal bag of trading tricks.
If you have comments, constructive criticisms or questions feel free to contact me.
sharpshorts2000@yahoo.com
Everything I do in the markets is documented on this home page
and the other pages listed on the right hand side.
Sharpshorts is a day-trader "slash" scalper, primarily using technical analysis and taking multiple trades every day. Each trade is of very short duration, usually less than 5 minutes of market exposure per trade.
But the information on this blog can be applied by longer term traders, swing-traders and investors as well. All of the things I describe on these pages happen on any time frame chart you choose to use. They also happen in any market you choose to trade.
Although I am aware of market news and fundamentals, I endeavor to keep from being overly influenced by the constant barrage of "financial news" stories published by market news organizations. Most financial news writers cater to a need that people seem to have for "understanding WHY" the markets did what they did...
As entertaining as the presented rationalizations may be, they can not be relied upon as trading tools.
I especially avoid listening to market pundits who present their expert opinion
about what "WILL happen" in the markets going forward...
IMO, it is somebody's expert opinion that gets us into any and every mess in the first place...
I trade primarily using the relatively simple technical methods that are described here.
These methods are combined with my"feel" for market actions.
Feel is the more difficult of the two to quantify.
I suggest you acquire the knowledge and own the tools I present on this blog before
throwing your hard earned money into the fray...When combined with chart-time experience
these tools will produce a reliable "feel" for the trade that will serve you well.
Charting Preferences - TICK vs TIME based
Most of the earlier charts on this blog are one minute intervals showing stocks and ETFs.
As I migrate toward concentrating on the e-mini futures I find TICK charts present
a clearer price action picture and are especially useful for trade entry charts:
Tick charts are also particularly good for studying the 24 hour price action of the e-minis.
Tick charts often display patterns that may not be quite as apparent on time based charts:
Some other differences in the way TICK and TIME type charts are rendered:

TICK charts: each bar represents the number of trades per bar that you chose.

TIME based charts: each bar represents the length of time that's chosen

Recurring Price Action, Patterns and Signals
It should be obvious that most of the charts on this blog were hand picked by me for illustration purposes.
Of course they were. They usually show a plethora of patterns and trade signals on each example.
Although multiple, confirming signals do occur quite often everyday, you must understand
that these things don't always occur simultaneously. Also be aware that the signals that
I'm pointing out do not occur before each and every price reversal...
Good trade opportunities do not require waiting for 'perfect' sets of signals to happen...
On some days, good trading signals print more frequently than they do on other days.
Rarely will good signals fail to print for an entire day...There will also be days
that good signals print but subsequent price action fails to print good reversal runs.
Rarely will good signals fail to print for an entire day...There will also be days
that good signals print but subsequent price action fails to print good reversal runs.
That's what STOPs are for :

♦♦♦♦♦ ♦♦♦♦♦ ♦♦♦♦♦ ♦♦♦♦♦
VI. REVERSALS RULE !
Section 6 of 6 -- Discretionary Technical Trading
♦ ♦ ♦ ♦ ♦ ♦ ♦ ♦ ♦
♦♦♦♦♦ ♦♦♦♦♦ ♦♦♦♦♦ ♦♦♦♦♦
VI. REVERSALS RULE !
Section 6 of 6 -- Discretionary Technical Trading
♦ ♦ ♦ ♦ ♦ ♦ ♦ ♦ ♦
Every trade entry decision I make is based upon a deliberate plan, made well ahead of each order placement. There are never any automatic trade actions taken...EVER.
Every day is different. My personal "feel" for what's currently happening in the market allows my subconscious to recognize actionable activity. Although feel for the trade does not guarantee better results, it does help me decide whether or not to Go-for-It when only minimal or marginal signals print.
4/01/2014
"Perfect" Signals for entering long positions
Sometimes multiple signals happen to print simultaneously.
Very often a second set of signals follow close behind the first set.

8/9/2013
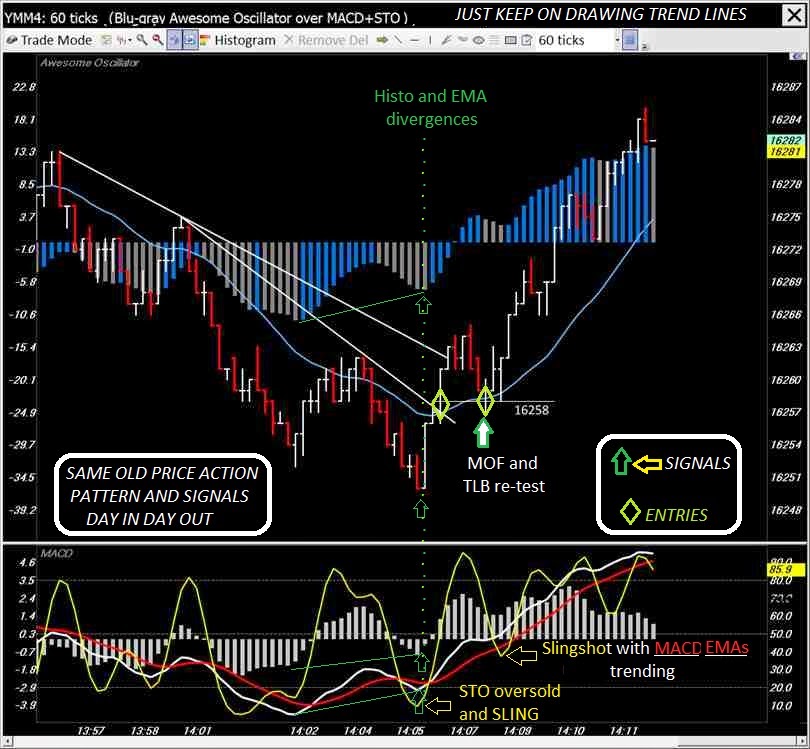
Signals and Patterns that continually repeatThe following is my description of what the chart below is telling me...
it is how I read charts :
P/A (price action) was in a down trend with LL's & LH's (lower lows and lower highs) ... 2xD (two indicator divergence) then developed, alerting me of the potential for an imminent change in direction*... price then broke the TL (Trend Line)** and made a new HH before retracing back toward the level where it broke out***... P/A then printed a HL MOF (money on the floor) with the MACD EMAs trending up at this point...P/A began to print HH's & HL's, describing a new up trend...

How I take positions based on the Signals and Patterns that are described above :
*1st long entry order signal - Market order - try to enter just below the TL level
**2nd long entry - Buy Stop - placed just above where price would break the TL
***3rd long entry - Limit @ the TL break level, for a TL break re-test entry.
You always have the option to take just one type of entry...or all three or none at all.
Do not be concerned about missing opportunities.
There will always be another trade.
This is the nature and beauty of discretionary trading.
**********************************
Going back in time
Most of pictures & descriptions below are rendered by MBTrader's DesktopPro chart software. These are some of the earliest on this blog. They were among the first ones added back when I started to publicly document my methods.
I became aware of most these ideas more than 25 years ago.
They have weathered the test of time and are as applicable today as they have ever been...
3/08/2012
3xD Buy STOP+TTO at the Trend Line trade
TTO = Threshold Trade Order a.k.a bracket order
Below is an example where I spotted the three indicator divergence (3xD) just a little too late to place a
Market+TTO order under the trend line (the dotted vertical line points out when the divergences in the study pane can first be spotted). But I was able to place an anticipatory Buy-Stop+TTO order at the
trend line before price broke out, which got a fill....For the NQ ($5.00 per tick) I had my TTO
offset order preferences set for a 6 tick protective sell stop
(1.50 points, or $30) and a 12 tick target stop (3 points or $60)...
Note
that after getting my fill, there was plenty of time to change the
order type to a Limit+TTO if I had wanted to try to add additional
contracts using a TLB-RT (Trend Line Break Re-Test) order...I like to add contracts at the TLB-RT area, especially after a first entry that had a very good fill -- like one that was filled immediately after the divergence was spotted, well under the trend line.
This is a 60 tick chart

3/14/2012
2xD Divergence can be powerful too...
A Limit+TTO order relies on a retest of a break-out point and is sort of a late-to-the-party trade relative to using a Market+TTO order immediately after divergences below the trend line are identified. But on most days they will provide good fills with reasonable stops. It is not always easy to to place 'perfect' under-the-trend-line-early-entry orders, especially on very active days.
Below is a 120 tick chart which draws price bars much slower than the 90T, 60T and/or 45T charts I usually use when trading the YM...but so far on this day, trade activity had been at a far greater pace than on average.
This chart shows where to place "late" limit orders...The solid lime line crossing the teal down trend line (circled area) is the trend-line-break level. In this example, both 2xD plays would have been filled on retests, without price coming near a tight 6 tick stop...you might even have gotten a better fill by a tick or two, if the order was entered while price was dipping...
YM Chart - 120 ticks per bar spanning about 2 1/2 hours

5/3/2013
2xD followed by 2xRD
The Lower Highs and Lower Lows price/action of the previous down trend on the lower left hand side of the price pane (yellow diagonal line) is reversed after the divergences developed. A new up trend is then defined by the series of Higher Highs and Higher Lows that printed after price broke above the down trend line.
Regular divergences (2xD) suggested an imminent trend change (LL on price while the MACDh and STO made HL's).
Reverse divergences (2xRD) suggests continuation of the 'new' trend (HL on price while the MACDh and STO made LL's)
Notice that this chart illustrates 3 potential entry points with good signals :
A --------------------- 2xD and then a TL break
B ----- TL break Re-Test MOF and Slingshot
C ------------ 2xRD continuation of new trend

to test the level where it broke out (TLB Re-Test) and printed a HL. This particular HL is also known as
a Money-on-the-Floor pattern while a Slingshot pattern is developing on the
stochastic indicator at the same time.
These two patterns help to identify and to confirm the reversal, from down to a new up trend...
They are both described in detail on my Money on the Floor page.
4/25/2013
2xD followed by 2xRD
2xD indicates the start of a new bullish trend...
2xRD then indicates an 'overdone' short term pull back has occurred...
I use this signal as confirmation that the new bullish trend should continue.I include this 120 minute-per-bar chart to demonstrate that price action works very similarly
regardless of the time frame you may choose to view.
In this example, over a month's worth of the DJIA e-mini sessions are included.

3/13/2012
Multiple Time Frames
Viewing multiple 'time frames' can be helpful in confirming 3xD trade signals and more. Here I'm using both 90 & 120 tick charts for the NQ e-mini futures. Divergence is apparent on both charts, suggesting an imminent trend reversal. The yellow, gray and red diagonal lines in both studies clearly show the divergences on each indicator. The aqua vertical line marks the point where the divergences can first be identified - that's when to place your orders.
The 90T allows you to optimize your entry and suggests where a reasonably tight stop-loss order can be placed...The 120T chart gives a better perspective for determining how much of a reversal you might expect from the divergence in order to set a reasonable target...

Comparing Histogram Divergences
Notice that the 90T on the right has a MACD histo and a TRIX histo in the study panes...Both are trend indicators and work very similarly - its just a matter of preference as to which to use (see the next chart for further comparisons)...The 180T chart also shows Stochastic divergence.Its not unusual to have divergence on one time frame but not on the others.

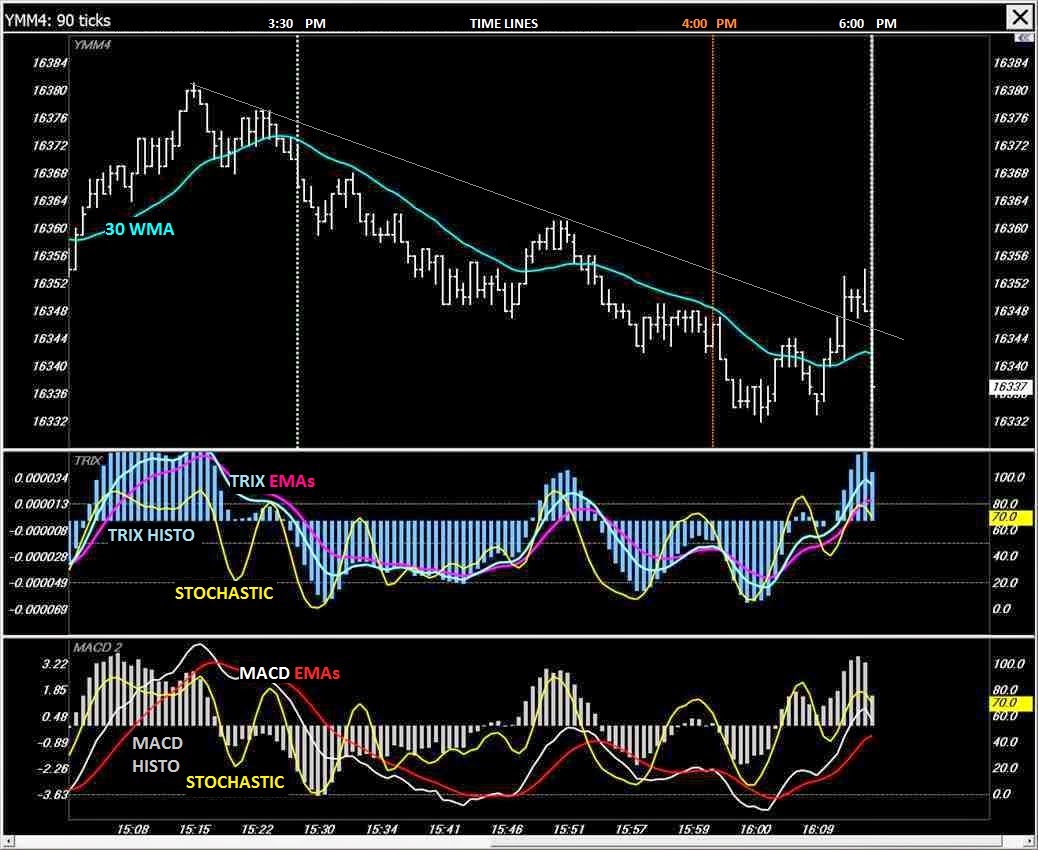
The following chart is for comparing the TRIX histogram with its EMAs to the MACD histogram and EMAs.
It also highlights relationships with the yellow Stochastic slow %D line and with price action.
You can see the similarities as well as differences easily...
Another comparison of differing histograms...the same price action and time span are shown on both charts
TRIXh over MACDh on the left hand side.................Awe Osc over MACD on the right

Other combinations of trending and oscillating indicators can work just as well as the ones shown above.
Most will show very similar shapes & patterns ...
In the charts above, the scales for the TRIXh, the Awesome Oscillator and the MACD (with it's EMAs) are on the left while the Stochastic is on the right. The actual scaling numbers are not that important to me. I'm more interested in seeing the relationships between the indicators with price. If my software would allow it, I would turn off all the left hand scales.
(I discovered a way to turn off the price pane's LH scale in later snapshots)
In my view, the stochastic and each of the histograms are oscillators...BUT the TRIX EMA lines and MACD EMA lines indicate trending attributes of price.
I do look at over-bought and over-sold positions of the stochastic line within the study pane...and although I use MACD EMA crosses, I do not concern myself so much about whether they occur above or below the center line.
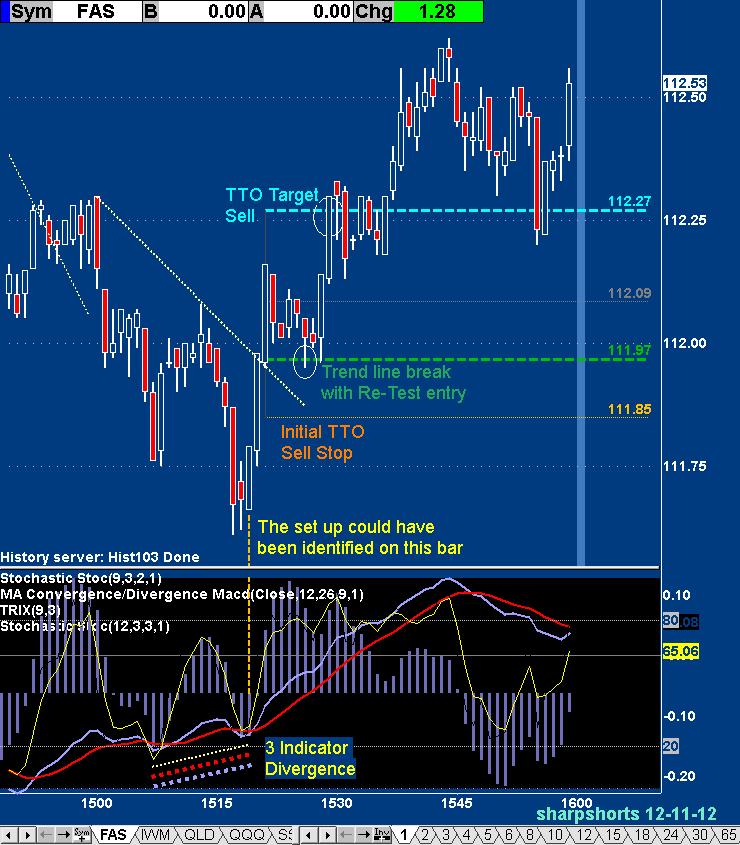
12/11/2012
The following set up presented three ways to make an entry...
1) Market+TTO entry below the trend line
(for immediate entry)
2) Stop+TTO at the trend line, directly above the developing bar
(entry order would be activated if or when price broke-out)
3) Limit+TTO at the trend line after the break-out
(requiring a re-test of the break-out level for entry)
(The links above take you to MBT's NavPro documentation - See chapter 13 - Order Type)
All three types of orders could have been deployed. After the 3 indicator divergence set up was spotted there was at least a minute to place the orders.
I didn't see it until after the trend line was penetrated but was able to participate on the move because shares happened to retrace to .01 below my limit @111.97 as price re-tested the breakout point.
The indicators in the study panes on these charts use a Stochastic (
9,2,3
yellow line), a standard MACD without a histogram (aqua and red lines)
and a TRIX
histogram (light blue bars). The other Stochastic (12,3,3) listed in the
pane is used to create the black background for the study. It covers
some background lines but is otherwise hidden. The last number (1)
listed within the parenthesis next to some of the legends for the indicators is the
chart interval...
12/10/2012
Three Indicator Divergence does not happen all the time but it usually allows for a very good scalp trade when it does. Note on the chart below that it occurred once at 11:30 but it was a bit more difficult to rationalize an entry being that it was harder to see where the trend line of the recent price action was...

12/06/2012
Another example of a three indicator divergence scalp trade allowing an entry before price action makes the breakout of the trend line.

12/07/2012
Entry signals - Divergence vs. Trend Line break retest
The chart below illustrates the power of 3 indicator divergence and the relative safety of this trade entry vs. playing a trend line break and waiting for a re-test of that point for entry.
Normally I would have cancelled order # 2 after three to five minutes since there was no immediate retest after the TL break, rather than leaving it live for the 15+ minutes as shown on the chart.

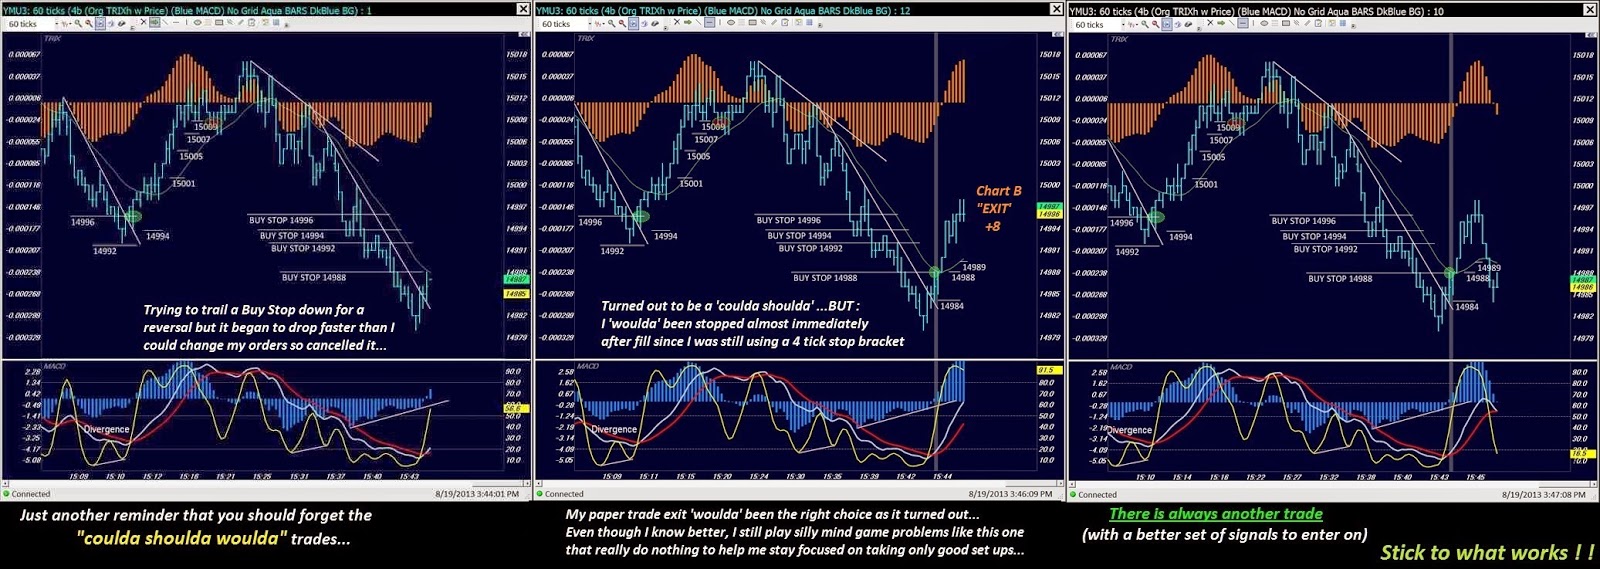
There is always another trade
Avoid second guessing your trade decisions - Learn from losing trades and yes, analyze stop-outs to determine if your entry reasons were valid...
But DO NOT second guess yourself or engage in coulda-woulda-shoulda thinking. These things will cloud your abilities and interfere with successful trading.

What happened later, you might be asking?
Talk about what second guessing and coulda-woulda-shouldas can do to you...
'I coulda used a 7 tick stop instead of 6, woulda won this trade...wonder if I shoulda increase it...'

Don't sweat the coulda-woulda-shouldas...
There is always another trade
Little can be gained by focusing on bad trades...unless you recognize them when they happen...
AND

3/19/2014
Good signals don't always guarantee a gain...
Using a Buy-Stop above price can keep you out of a trade that does not move in the direction you were anticipating...
Here's an example when good signals fail to reverse P/A...The signals firing on the LH chart suggested that a reversal, from down to up was potentially imminent.
Spotting the signals, I placed an order...because I was "trailing-down" my buy-stop order (placed above the TL and above the current bar), I was not filled before price continued to fall (see RH chart)...thus saving me from having to rely on my stop-loss to limit the damage from a losing trade...
The green Buy-Stop order line and white auto offsets are shown on the charts.
You can drag & drop the order line to trail a buy-stop down - this will also move the offsets correspondingly.

Good signals don't always guarantee a gain...nor do they guarentee a reversal.
Sometimes price changes its direction from down to side ways.
Sometimes there are multiple 'good' signals but they 'fail'.
AND
Sometimes price will reverse without giving any signals at all.

**********************************
You have to continually ask yourself the question:
"Do you trade for excitement or to take money from the market?"
Well, do you?