Record keeping is essential
In addition to using something similar to the spreadsheets that are presented further below, I recommend that you maintain a Trading Notes Log (daily/weekly/monthly) to record your current thoughts and observations. This entire blog is my personal Trading Log , a Blog-Log if you will.
Besides scanning countless stock charts, reading market news and of course day trading, everything described on this page is faithfully, habitually adhered to...Everything is done so that I can review
"where I was" and focus intelligently on planning "where I want to be"
My statistics indicate that over the long term including thousands of trades, a winning trade percentage of 54% to 59% is about my average range per month. In the long term, if my winning trade percentage averages in the low 50% range, in order to continue in this line of work and be profitable, I must maintain a $Won/$Lost ratio of at least 2 1/2 to 1...that is, a ratio 2 to 3 ticks won for every 1 tick lost. I need to maintain a positive $Won/$Lost ratio and keep my winning trade percentage above 50.
Ideally you want one winning trade to capture more $$$ than it takes to cover the losses from two losing trades. Then all you need to do is get your winning trade percentage to rise...If 75% or 90% of your trades are winners then you can probably just look at your account balance once in a while to tell if you are successful.
Otherwise, you need to keep track of your trading by constantly monitoring all the numbers.
Simple Spreadsheets
The following are snapshots of a single spreadsheet combining five workbooks that I've developed
for compiling and analyzing my futures trading statistics.
The spreadsheet for keeping Equities and ETFs statistics is different and can be viewed via this link.
I track Daily (workbook 1) and Monthly (workbook 2) trading activity to gather and compare my statistics over time. I created a Projection Tool (workbook 3) that is used to extrapolate potential results using the numbers compiled in the first two sheets. Of course you can't forget uncle Sam so a Schedule D tax form (workbook 4) is included. And finally a combined Per-Contract and NET Amounts (workbook 5) completes the set.
1) Daily Win-Loss Workbook (Trade Log) - Futures
This is the main workbook - it gets filled out daily.
For your personal use -- DOWNLOAD -- a copy of the Statistic Spreadsheet.
On the top right of the page that opens, click Login then sign in using
sharpshorts3001@gmail.com and password abc123
A freeware program may be needed to run the spreadsheet... Apache-OpenOffice

The formulas for all the cells are included should you wish to create your own spreadsheet.
Notice the 5 tabs along the bottom of the workbook...The spreadsheet will remain open
but will switch to each individual workbook via the tab that's selected.
An advantage to creating a single spreadsheet with multiple workbooks is the ability to "link" data from one workbook to another. I've designed this spreadsheet so that only the cells in columns 'A' through 'G' need to be filled out - columns ' I ' through 'O' on this workbook are automatically updated, as are any "linked" cells in the other workbooks.
Note: I have made some changes to the spreadsheet since uploading the picture to this blog (back in 2013) ... Click this link for a snapshot of the current 2017 Daily Win-Loss Workbook.
2) Monthly Statistics Workbook - Futures
All cells are "linked" so they automatically update when filling in the Daily Win-Loss workbook.
All cells are "linked" so they automatically update when filling in the Daily Win-Loss workbook.

The formulas for all the cells are included should you wish to create your own spreadsheet.
3) Projection Tool Workbook - Futures
Used to see where I've been and where I can improve. Changing the values in the yellow cells produces
the results in the blue cells (the cell formulas are included on the picture).
Used to see where I've been and where I can improve. Changing the values in the yellow cells produces
the results in the blue cells (the cell formulas are included on the picture).

The formulas for all the cells are included should you wish to create your own spreadsheet.
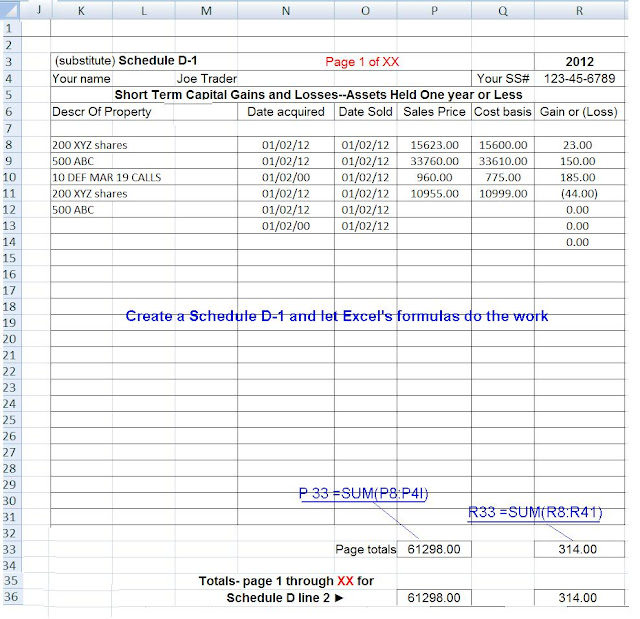
4) Tax form Workbook
(5) Additional Simple Workbook
This one is used to get an idea of what to expect when 1) changing the market traded...2) changing the bracket order levels used...and/or 3) changing the number of contracts traded...
The top picture has the same numbers inserted for the 4 markets that I trade.
The bottom one shows differing numbers inserted in the Stop-Loss, Target and contracts cells.
4) Tax form Workbook
Updated daily or weekly so as not to get too far behind.
Who needs to pay an accountant?

(5) Additional Simple Workbook
This one is used to get an idea of what to expect when 1) changing the market traded...2) changing the bracket order levels used...and/or 3) changing the number of contracts traded...
The top picture has the same numbers inserted for the 4 markets that I trade.
The bottom one shows differing numbers inserted in the Stop-Loss, Target and contracts cells.

05/25/2015... I updated the workbook above to include how NET dollar amounts are affected by Win/Loss percentages, by bracket settings and by the number of contracts traded.
The Net Dollar Amounts part illustrates that you need to take 2X as many contracts per trade with the YM and NQ to NET about the same return as a single contract with the RUT and ES.
You can also see the big role that commissions play on your bottom line.
You can also see the big role that commissions play on your bottom line.

The cell formulas for the above workbook are included in the picture below...

Another look at the Projection Sheet
I've adjusted just the numbers for Contract $ Per TICK and Ave. #of ticks WON per contract (yellow cells) to get similar sets of results for each contract's Net Gain (blue cells - weekly, monthly and yearly). The results in the blue cells indicate that trading the ES or RLM might be more advantageous than trading the YM or NQ.
In order to get similar bottom line results when trading the different markets :
YM & NQ - you need to average 15 ticks won vs. 4 ticks lost per trade or a 3.8 -to-1 ratio
RLM - you need to average 9 ticks won vs. 4 ticks lost per trade or a 2.3-to-1 ratio
ES - you need to average 8 ticks won vs. 4 ticks lost per trade or a 2.0-to-1 ratio

______________________________
Other Tools and recommendations:
Capture pictures of your Trades
I consider taking snapshots of my trades an essential part of my record keeping. I recommend that you capture a picture of every trade you take, each and every day...I have been doing this for years.
This may seem as though it would be a major hassle or distraction, a task that you would rather do without. But I'm telling you that it can work wonders for advancing your trading skills by providing important feedback and insights that you might otherwise overlook.
All my daily trade chart pictures are available for viewing on Sharpshorts Daily Trade Results ...
All my daily trade chart pictures are available for viewing on Sharpshorts Daily Trade Results ...
I capture a picture of every trade I make (it takes less than a second*) as well as those of other charts that I find interesting or important. At the end of the day they are reviewed, renamed and filed by date (see the picture below)
All of this is simple to do and takes an inconsequential amount of time to accomplish.
In addition to the benefits mentioned above I have further reasons for doing this:
1) For keeping track of gains and losses for filling out my Daily Trade Log
2) A quick way to review the day's action after market hours
3) An easy way of reviewing good and bad trading days and methodologies
4) To keep visual records that are accessible weeks, months or years later
This is a terrific free program which allows you to:
1) capture a chart image, 2) name it, 3) save to file instantly
using just a single click of the mouse.
It is similar to Microsoft's Snipping Tool or PrintScreen-copy-to-clipboard but you need not contend with filling out the properties windows each time you elect to take a picture. All of the pictures on this blog were captured with Gadwin PrintScreen.
The Gadwin program can be set up to save, date and number your screenshots to any folder you designate or create. You can have Gadwin re-size any snapshot taken and choose to have it's aspect ratio kept. It can be quickly reconfigured to take snapshots of just the window that's in focus, of any client window (including an entire array of multiple monitors), of the full screen (an individual monitor) or of a drag-able rectangular area.
(... add'l link to Gadwin Properties set-up...)
Sept 2015 NOTE:: Gadwin's 4.7 version is no longer available through their website. Their most recent freeware version has some additional features over 4.7 but does not include a 'one click' snapshot of just the chart window that is under the cursor.
PrintScreen 4.7 freeware is still available via up-to-down's website . Both the new and older versions can be installed and operated at the same time without conflicts...set each version up to use a different keyboard or mouse button but have the capture folder the same for both...
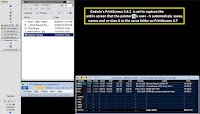
I set the 4.7 version to snap just a single chart window and the 5.4.2 version to snap
all the stuff that's on an entire monitor. I also use M/S's Snipping tool
for capturing any sized rectangular area, of anything I can see on any of my monitors.
Gadwin 4.7

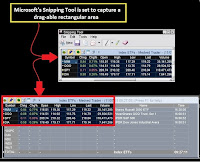
all the stuff that's on an entire monitor. I also use M/S's Snipping tool
for capturing any sized rectangular area, of anything I can see on any of my monitors.

Gadwin 5.4.2.................................................................................................................Snipping Tool


Snapshot Management
The left hand folder is where all the pictures go during the day - automatically named and saved.
The other folders are where I move them after reviewing and renaming. I do this each market day when I'm done trading for the day.

Freeware Office Program
The Apache download site offers an alternative to Microsoft's Excel spreadsheet and Word programs - - FREE
I had been using Microsoft's suite of office programs since at least 2001. Recently I built a new computer and wanted to have the same set of programs on the new machine that I had been using on the old one. Rather than spending the $100 plus to purchase a new license from Microsoft, I downloaded Apache's Open Office program and transferred all my existing Word documents and Excel spreadsheets to it. Can't beat the price and I have found nothing lacking with Apache's product.
Start a blog as your personalized trading log
Google blogs are easy to set up and simple to edit - FREE -
Everything that I have posted on this blog could also be done using a word processing program...but keeping a blog on Google's cloud offers a lot of benefits over storing all your stuff on your own machine. Blogs can be set up to be published (available to the public) or can be strictly private and unpublished...You can choose to publish some pages while keeping others private.
Maintaining a blog is a terrific way to consolidate your trading records and thoughts in one place - it makes you "place your ideas down on paper" which reinforces them the the mind's eye, i.e. the subconscious. You learn to write in a manor that is coherent and concise. These things are important tools for developing reasonable analyzation skills and for coming to important conclusions about your trading skills.
You may find that maintaining a Blog-Log helps to turn on that light inside of you...
You may know certain things are true but can only express a feeling about why they are true.
Keeping a Blog-Log can cause such things to become much clearer.
****************************************