Trend Lines


 The example above turned out to be a good trade even though there were no early signals to suggest that a trend change might be imminent...
(Note that the MOF and Slingshot signals could not be identified until after price broke the trend line)
An added advantage of using trailing BUY-STOP orders above a trend line (and above the currently developing bar) is that they can keep you out of a losing trade if signals do not develop or when price just continues to trend down without a reversal.
...but sometimes the bear eats you anyway...
Trend Line Breaks
8/29/2013
Price breaking a trend line is a good signal that a down trend may
be reversing. I use three basic methods to enter the market using TL's...
illustrate the price action that describes the general shape of Trend Line Breaks.


YMU3 mini futures 45 tick chart early into the new session...This is a simple HLC bar chart.
30 WMA and TRIX histogram in with price...Session volume to the right and MACD with histogram
combined with Stochastic in the study pane.
.jpg)
Understanding Support/Resistance and "Free air" can be helpful for deciding
when enough IS enough
.jpg)
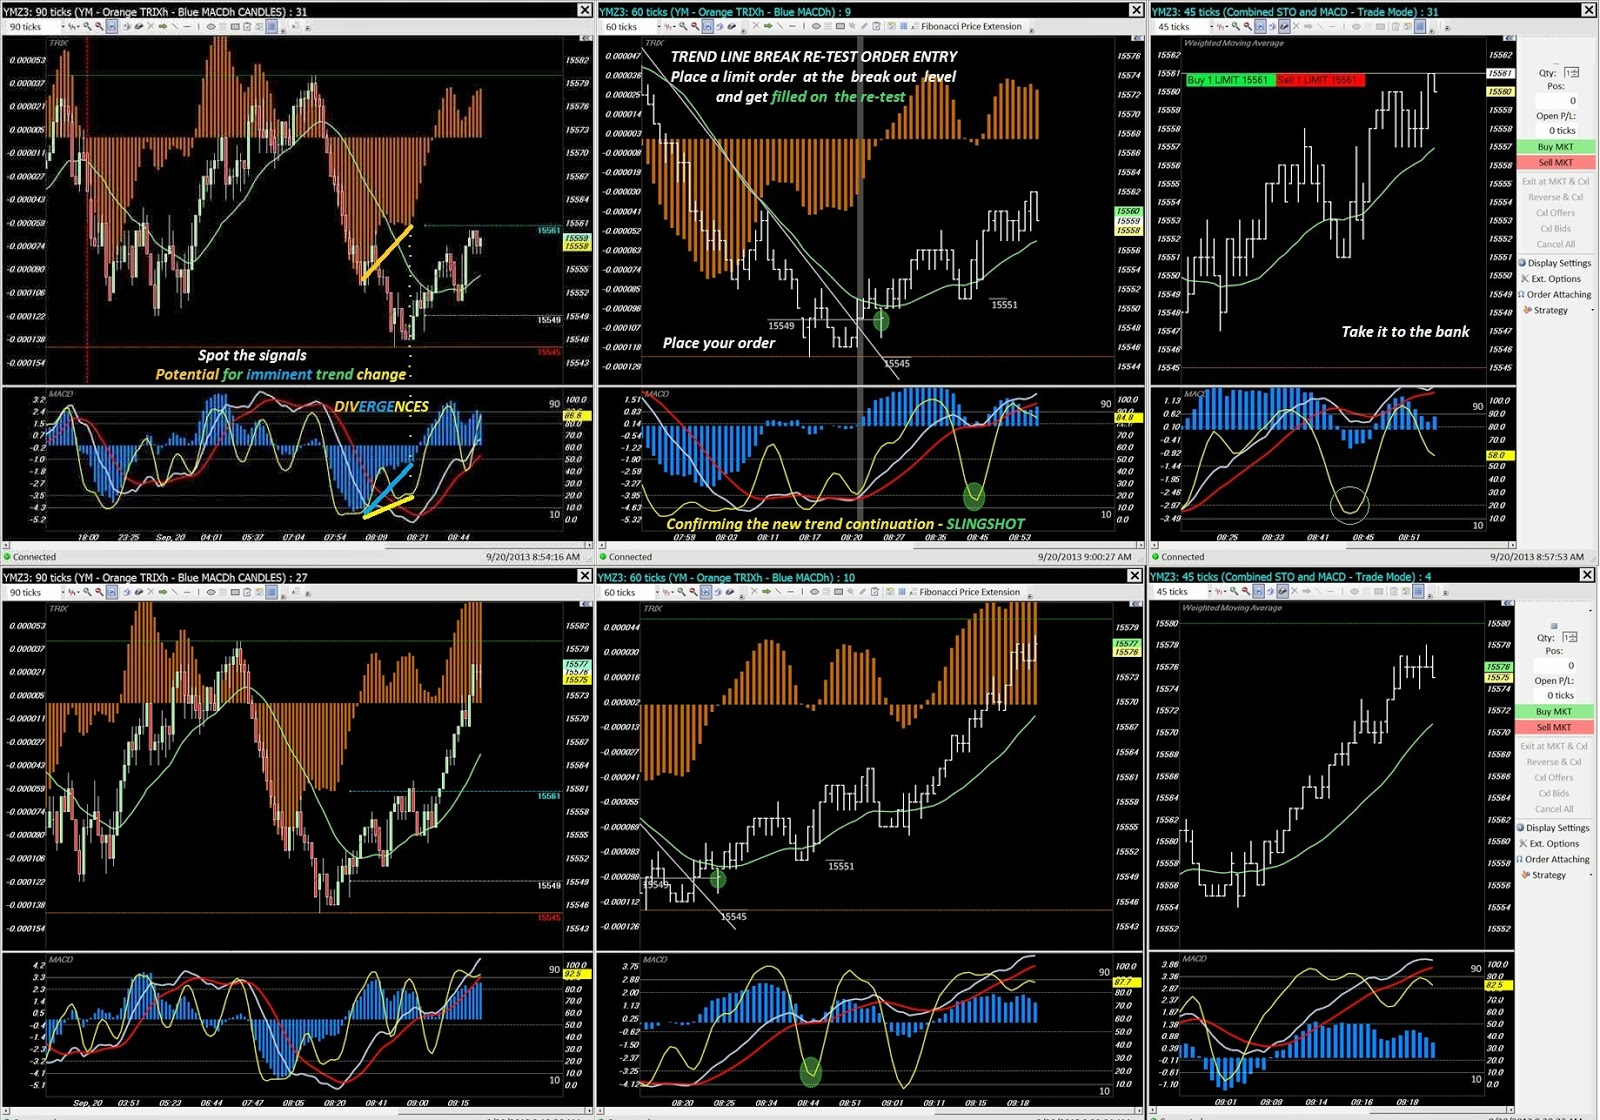
9/20/2013 TLB-RT
Trend Line Break with a retest...

7/11/2013 "Perfect" Signals

6/06/2013 using TRIX to spot Divergence
TRIX histograms in the price pane make it very obvious... once again - divergence suggests a potential for imminent trend change.
The trend line getting penetrated tells you: 1) when to take a position and 2) at what price level
 Above - the divergence between price and the TRIX histogram was very clearly seen, with price making a lower low while TRIXh was making a higher low. There was also divergence in the study pane, with both the MACD and the MACD histogram making higher lows (these were just a bit harder to see at a glance). In this case the stochastic was in the over-sold buy area but was not showing divergence.
The arrow marks the point where price broke up through the trend line @14937...your limit order should be placed at that level.
12/31/2012 Regular and Reverse Divergence

01/07/2014 Reverse divergence

____________________________________________
10/14/2012 TREND LINE BREAK and RE-TEST
An example of entering a trade in the YM mini futures...
A Buy Limit+TTO order was placed at the trend line, under the bar that broke through the trend line. Price then re-tested that level on the next bar, filling the order.

1/14/2013 Another Futures Divergence play below...
Waiting for divergence plays can be tedious and boring but patience rewards you...you need to ask yourself the question - Do you trade for excitement or to take money from the markets?

It does not happen all that often but it gives you that extra confidence to take the trade...
Your choice of oscillators makes little difference for spotting divergences. On the chart below I was using the RSI oscillator along with the MACD histogram trend indicator.
As an aside, many years ago a trader (I think his handle was BlackIV) on the ClearStation website suggested to me that you can see and use other patterns in indicators, like a Head & Shoulders in William's %R...just keep your mind open to ideas - see if they can work for you...
Light green charts are from 2012
Scalping using MACD Divergence
Spotting divergence in the immediate proximity of a trend line break can offer an additional rational for entering a buy order. Here the exit was in the area near the longer term trend line for a scalp.

Sometimes you can use either the MACD or HISTOGRAM divergence to enter early, below the trend line. Sometimes both the MACD AND HISTO are divergent which is a stronger signal.
Drawing trend lines can help you "see" potential trend reversals...I got into the habit of drawing them many years ago, well before I developed my current trading style. Trend lines form the basis for everything described throughout this blog...They are at the heart of my trading methodology. They give me that little bit of 'edge' needed to have confidence in all the rest of the things I use - the Price Action, the patterns, the signals etc.
There are many different ways to "see" trend-lines

Price Action Trend Line Break

06/18/2016...TLBs suggest imminent trend changes
Trend lines are reflections of Price Action and can suggest what is happening with prices...
These next two charts show a couple of ways to use trend lines for taking long positions.
After some indicators had printed signals
Price Action via a TLB was used as the TRIGGER to BUY.
 This 2nd opportunity followed closely behind the one above...It also used P/A via an MOF pattern
which confirmed that the TLB had indeed reversed the former down trend.
This example used Indicator Signals as the TRIGGER to BUY.

Often if you miss the 1st opportunity you get a second chance to enter the new up trend.
I call the above trade "Late to the party" because it's the 2nd entry in the reversal that's already underway.
05/11/2016... Price-Action and TLBs

10/29/2014

06/18/2016...TLBs suggest imminent trend changes
Trend lines are reflections of Price Action and can suggest what is happening with prices...
These next two charts show a couple of ways to use trend lines for taking long positions.
After some indicators had printed signals
Price Action via a TLB was used as the TRIGGER to BUY.

which confirmed that the TLB had indeed reversed the former down trend.
This example used Indicator Signals as the TRIGGER to BUY.

Often if you miss the 1st opportunity you get a second chance to enter the new up trend.
I call the above trade "Late to the party" because it's the 2nd entry in the reversal that's already underway.

10/29/2014
01/02/2014
Draw trend lines for using trailing BUY-STOP orders, placed above the trend line in a minor down trend...Place them in anticipation of capturing a break-out even if no other signals have yet developed on your chart...

(Note that the MOF and Slingshot signals could not be identified until after price broke the trend line)
An added advantage of using trailing BUY-STOP orders above a trend line (and above the currently developing bar) is that they can keep you out of a losing trade if signals do not develop or when price just continues to trend down without a reversal.
...but sometimes the bear eats you anyway...
Trend Line Breaks
8/29/2013
Price breaking a trend line is a good signal that a down trend may
be reversing. I use three basic methods to enter the market using TL's...
- 1) anticipate a break-out by reading indicator signals and try to get a position while price is still below the TL
- 2) follow a TL down with a trailing buy-stop placed above the current price bar and just above the TL
- 3) wait for price to break a TL then place an order at that level, looking for price to re-test (TLB re-test)
illustrate the price action that describes the general shape of Trend Line Breaks.
01/02/2015...Trend Line Breaks
04/27/2015...Trend Line Breaks, Time Frames and signals

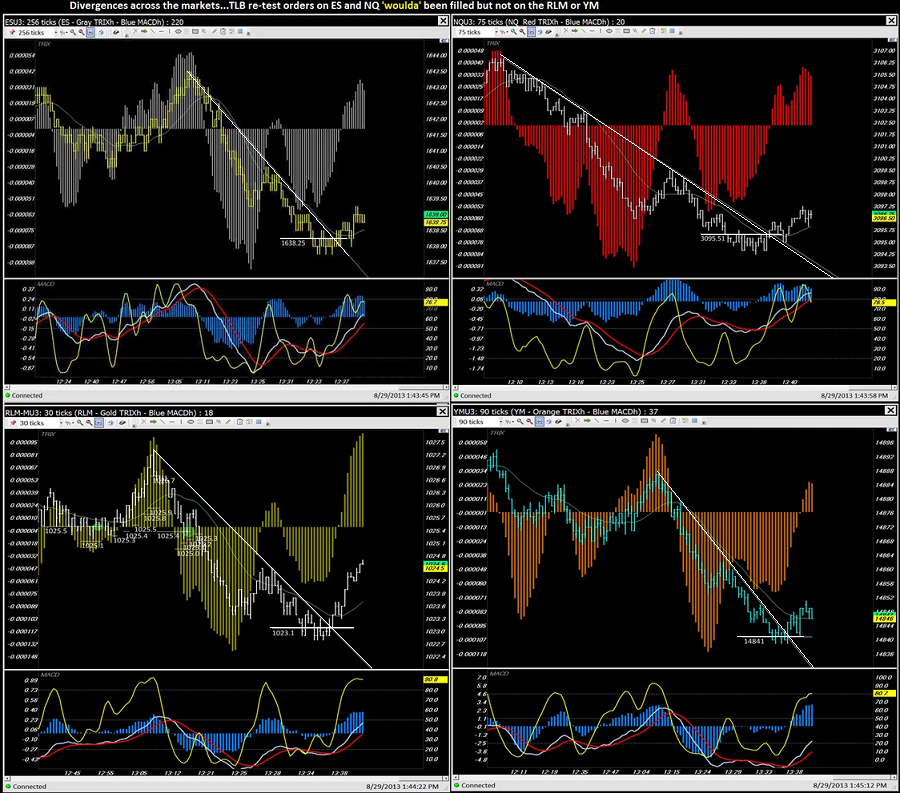
Wednesday June 19, 2013 And when is enough enough?
YMU3 mini futures 45 tick chart early into the new session...This is a simple HLC bar chart.
30 WMA and TRIX histogram in with price...Session volume to the right and MACD with histogram
combined with Stochastic in the study pane.
Understanding Support/Resistance and "Free air" can be helpful for deciding
when enough IS enough
9/20/2013 TLB-RT
Trend Line Break with a retest...
7/11/2013 "Perfect" Signals
6/06/2013 using TRIX to spot Divergence
TRIX histograms in the price pane make it very obvious... once again - divergence suggests a potential for imminent trend change.
The trend line getting penetrated tells you: 1) when to take a position and 2) at what price level

The arrow marks the point where price broke up through the trend line @14937...your limit order should be placed at that level.
12/31/2012 Regular and Reverse Divergence

01/07/2014 Reverse divergence
____________________________________________
10/14/2012 TREND LINE BREAK and RE-TEST
An example of entering a trade in the YM mini futures...
A Buy Limit+TTO order was placed at the trend line, under the bar that broke through the trend line. Price then re-tested that level on the next bar, filling the order.
1/14/2013 Another Futures Divergence play below...
Waiting for divergence plays can be tedious and boring but patience rewards you...you need to ask yourself the question - Do you trade for excitement or to take money from the markets?

3xD on three different time frames
It does not happen all that often but it gives you that extra confidence to take the trade... 

Your choice of oscillators makes little difference for spotting divergences. On the chart below I was using the RSI oscillator along with the MACD histogram trend indicator.
As an aside, many years ago a trader (I think his handle was BlackIV) on the ClearStation website suggested to me that you can see and use other patterns in indicators, like a Head & Shoulders in William's %R...just keep your mind open to ideas - see if they can work for you...

Light green charts are from 2012
Scalping using MACD Divergence
Spotting divergence in the immediate proximity of a trend line break can offer an additional rational for entering a buy order. Here the exit was in the area near the longer term trend line for a scalp.

Sometimes you can use either the MACD or HISTOGRAM divergence to enter early, below the trend line. Sometimes both the MACD AND HISTO are divergent which is a stronger signal.
Placing
a market or limit order while price is still below the trend line can lead to an especially
good entry...But often price will scoot further down and you get stopped
before the anticipated reversal happens.
Using a Buy Stop+TTO order at or above the trend line when the divergence is first noticed can get you in on a sharp move up that often occurs after divergence...keep moving your order down as price stays below the trend line. If price does not react to the divergence and continues downward, you avoid an entry that gets your protective stop executed before price moves in the anticipated direction.

Also be aware of Reverse divergence:
On the chart below, Regular divergence on the MACD histogram and on its EMA lines printed @1230 - which was followed by Reverse Divergence @1250.
Notice that the MACD EMA lines did not show reverse divergence @1250 while the histogram did - but by then the lines were clearly indicating that the trend was moving to UP.
Although the MACD indicator is often regarded as a single "trend-indication" tool, I'm suggesting that you should learn to read both components.

I have set my platform's TTO preferences to use a +.26 target with a -.10 stop loss._

Basically its buying a breakout of a down trend line
Enter a limit order plus TTO at the trend line break, looking for that level to be retested. Some orders get filled, some are not filled.
Closing TTO orders are placed automaticly by my broker's system once the limit portion is executed...
Today I've stipulated a TTO stop of .11 under my limit and TTO target .20 over.
With TZA, the liquidity is there for 1000+ share trades without a lot of slippage when either the stop or target order is filled; the auto closing of your position will be executed as market orders.

The first order entry at 24.42 was not filled as price did not retrace back to that level. The 2nd order was filled at 24.50, 2 minutes after order placement and was automatically closed @24.69 once the last price traded at the upper TTO trigger at 24.70...total market exposure lasted about 6 minutes with .01 slippage, netting +.19 on the scalp.
6/14/2013 Trend Line Scalp

