MBT DesktopPro charting features
Included on this page are some of the features available within MBT's Charting software.
MB Trading provides the program to their clients at no charge. I used it for years.
They continually upgrade the package, adding to an already strong set of options.
Their platform offers live data Demo accounts too. Some experts claim that paper trading is a waste of time because the pressure of using real dollars is eliminated. I disagree and have found that using the Demo platforms allows you to get familiar with the programs, view real-time market action and test trading methodologies. Also going back to the Demo is helpful when your real trading hits a rocky patch - you can still observe market action while re-developing your "feel" without it costing you equity.
MBT DesktopPro - Features
6/26/2013 Overlay charts on charts:
You can put a Bull ETF chart over its corresponding Bear ETF (like SSO over SDS) for relative comparisons of their price action. Or overlay a TICK chart on a futures symbol chart and make it look like a study pane...
Use your imagination...combine signal-charts and trade-charts using the features and tools that are available...
 11/09/2013 Another set up using the Overlay feature
 _________________
3/11/2013 Minimal Charts
Included on this page are some of the features available within MBT's Charting software.
MB Trading provides the program to their clients at no charge. I used it for years.
They continually upgrade the package, adding to an already strong set of options.
Their platform offers live data Demo accounts too. Some experts claim that paper trading is a waste of time because the pressure of using real dollars is eliminated. I disagree and have found that using the Demo platforms allows you to get familiar with the programs, view real-time market action and test trading methodologies. Also going back to the Demo is helpful when your real trading hits a rocky patch - you can still observe market action while re-developing your "feel" without it costing you equity.
6/26/2013 Overlay charts on charts:
You can put a Bull ETF chart over its corresponding Bear ETF (like SSO over SDS) for relative comparisons of their price action. Or overlay a TICK chart on a futures symbol chart and make it look like a study pane...
Use your imagination...combine signal-charts and trade-charts using the features and tools that are available...


3/11/2013 Minimal Charts
You can set up a set of small charts to reflect just the things you want to see and save their properties using the right click item 'Chart Styles'. The snapshot below reflects an example of how I use 'minimal charts' ...You could include these symbols in a Watchlist but I'm more interested in seeing certain values that are easier to see at a glance via charts, such as the relative differences between the Advancing and Declining issues...
To create 'minimal charts', set the chart size so that the symbol shows in the Title Bar and use the following features to enhance the chart's look :
Turn off the X scale (right click menu, Axis and Grids)
Remove Y scale (Chart Properties - Text Color = Chart Background)
Price flags (Chart Properties - Set Font Size and Select Line colors)


Note the vertical line on each chart - they are Session Color lines, explained below in a separate post. They help to make sure that all four charts are in alignment. Although it wouldn't matter, as far as the price flags go if they were not all the same, I use the Color Group for ease of changing their time frames when viewing Maximized. Usually they are all set to a one minute Interval.
Another set of minimalist charts using the Snapshot instead of the Title bar

_________________________________________________
I started using MBT's latest version 2.2.0.32 (RC). While it is still in beta mode it has some new or changed features that I really like. Some are minor but they make a big difference to me:
1) Studies - Added MACD Histogram Only and VWAP to the Studies menu.
2) Scaling - Added ability to configure the Chart Y Axis Increment Setting
3) Watchlist - Words in Symbol column no longer show -O- in Change col.
4) Market Depth Ladder - Profit & Loss colors can now be adjusted to suit
5) Order and Position Lines have controls for where they show on charts
_____________________________
Some Watchlist features
(click on picture to enlarge)

(click on picture to enlarge)

______________________________________________
Combining Studies into one pane


Add'l ways to combine Price with Studies

MBT's Main window

Main window re-sized with explanation of Toolbar "Docking"

________________________________________________
Snapshot menu & adding Order Entry box to a chart
Snapshot menu & adding Order Entry box to a chart

____________________________________________
Some Annotation/drawing tool tricks
Since I don't use Fibonacci Arcs or Extensions as they were intended I've adapted these drawing tools to other purposes. Once you set up these tools to your liking, remember to 'Name' and 'Save' them. Then click the 'Save Changes and Make Default' button - this allows you to draw new grids and circles on your charts with just two clicks - one on the Drawing ToolBar, the other on the chart.
 The picture below shows some more right click menu items that can be added to charts, other ways to access tools and additional windows that can be opened on your desktop.
 _____________________________________________________
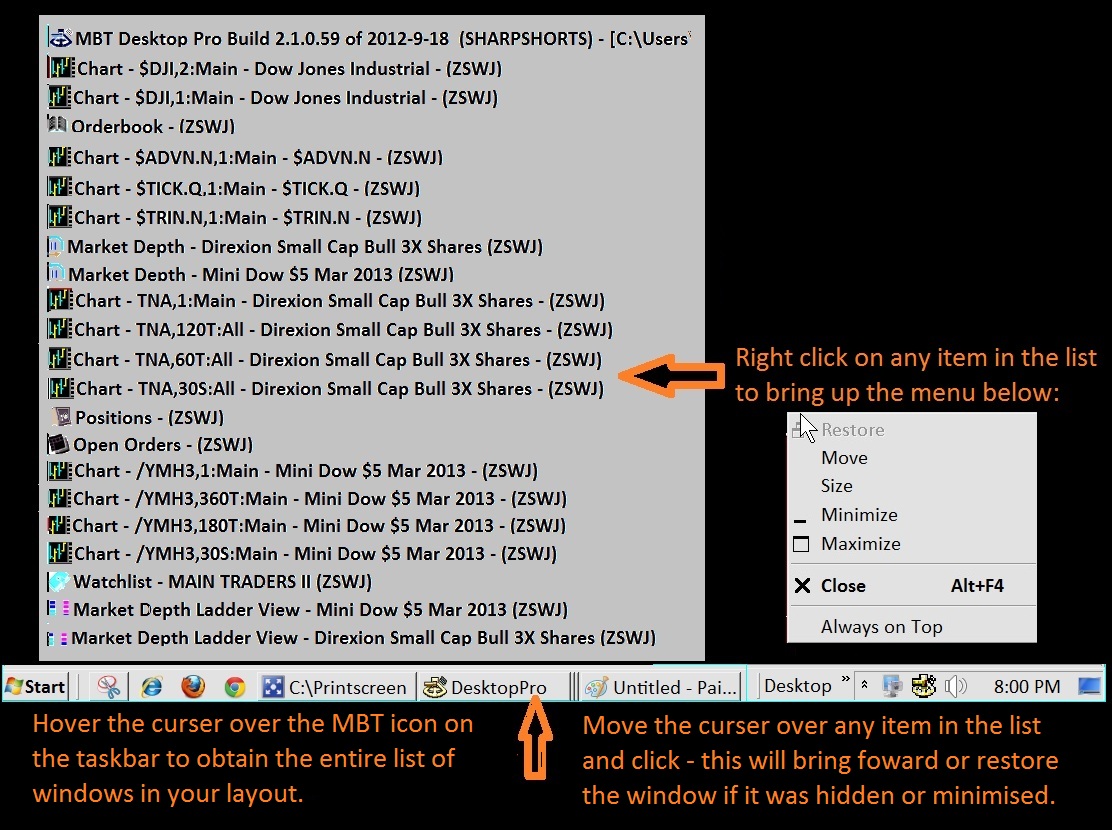
2/12/2013 Adding 'free' screen real estate and consolidating your Taskbar Icons
When you run out of screen real estate, there are some tricks for managing a large number of open MBT windows. Rather than "tiling" charts and/or windows behind one another and trying to leave part of each visible for
simple, quick-click access, try opening a new window and using the Maximize/Minimize buttons to send it to the taskbar when you don't want to view it.
Of course this fills up the taskbar rather quickly, plus you can't see enough of the icon to tell which window is which. See the pictures below for how to consolidate your set up and see how easy it becomes to identify your charts and windows, whether they are currently restored up or down.


Another Taskbar trick
Below is a trick I use for setting up my desktop to maximize its usefulness. First, right click the taskbar and uncheck "Lock the Taskbar". Then drag it either the left or right side of the screen and stretch it wider...Taskbar icons will show more of each window's title, making ID'ing charts and programs much easier.

Adding 'free' screen real estate part II
 Note- the empty back space on the left side of monitor 1 is there because it's a smaller monitor an has a lower screen resolution than monitors 2 and 3.
Adding 'free' screen real estate part III
If you use multiple monitors but find you still need extra desktop space, here's another couple of tricks that can be used...You can expand MBT's main window so that it covers two monitors that are situated vertically in relationship to each other...this opens up screens for other programs to use...


____________________________________________
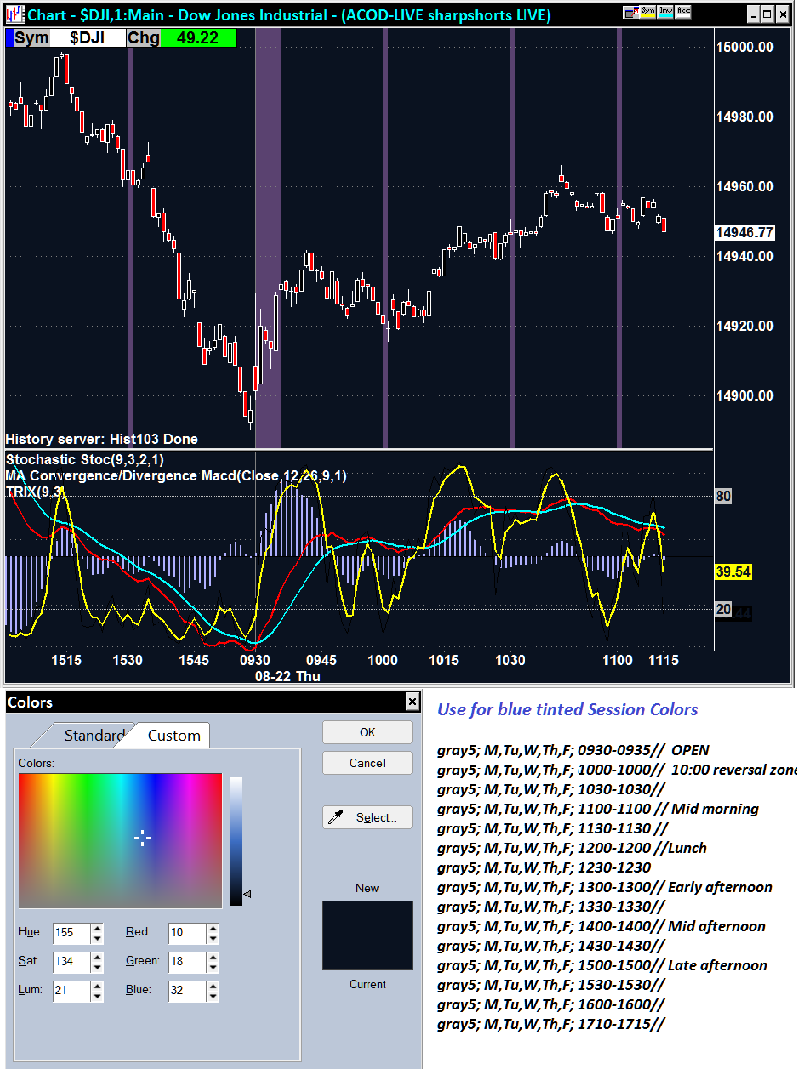
Session Color - Vertical lines
2/13/2013 You can add shaded vertical lines to your intra-day charts by using the chart's right click menu item "Session Color" . They can be set to show for any time interval...I use them instead of having the Axis&Grids/Major X and Minor X&Y show on my charts.
The picture below shows two charts - a 2 minute and a 1 minute with session color lines. They are set to be 45 or 46 minutes apart and their color shows up as a lighter shade of blue...
 Below I've listed the codes I used for the charts above...By adjusting the number after the 'gray' , the line 'tint' can be changed (1 minimum, 8 maximum). The time can be adjusted to get the lines to show for any amount of time: I used 45 and 46 minutes between entries so that the lines would show on both 1 minute and 2 minute charts. You can include notes after the // if you like.
NOTE: If you change to a 3,4,5 or other minute chart, some of the lines won't show up because the time frame can't be divided evenly into the session time used. Session Lines don't work on tick charts.
Copy/paste the code below into the Session Color Property window to get started.
More on Session Colors


MBT Available Studies, Plugins
and Moving Averages

Some Annotation/drawing tool tricks
Since I don't use Fibonacci Arcs or Extensions as they were intended I've adapted these drawing tools to other purposes. Once you set up these tools to your liking, remember to 'Name' and 'Save' them. Then click the 'Save Changes and Make Default' button - this allows you to draw new grids and circles on your charts with just two clicks - one on the Drawing ToolBar, the other on the chart.


2/12/2013 Adding 'free' screen real estate and consolidating your Taskbar Icons
When you run out of screen real estate, there are some tricks for managing a large number of open MBT windows. Rather than "tiling" charts and/or windows behind one another and trying to leave part of each visible for
simple, quick-click access, try opening a new window and using the Maximize/Minimize buttons to send it to the taskbar when you don't want to view it.
Of course this fills up the taskbar rather quickly, plus you can't see enough of the icon to tell which window is which. See the pictures below for how to consolidate your set up and see how easy it becomes to identify your charts and windows, whether they are currently restored up or down.

Once the above is done, hovering over MBT's single taskbar icon brings up a list of all the windows you have open...each with a full description of what the window is, whether its a Chart, a Market Ladder, an Orderbook etc..
Another Taskbar trick
Below is a trick I use for setting up my desktop to maximize its usefulness. First, right click the taskbar and uncheck "Lock the Taskbar". Then drag it either the left or right side of the screen and stretch it wider...Taskbar icons will show more of each window's title, making ID'ing charts and programs much easier.

Adding 'free' screen real estate part II
2/16/2013 This trick is a little bit more complicated to explain but once it is set up and used a few times it becomes very simple and practical...The idea is to be able to quickly view a wider variety of charts and symbols without having to change back and forth between saved layouts.
I noticed that if I used the Minimize button on a chart's title bar to send it to the taskbar windows list, it would automatically Restore-up each time I cycled through Restore-up and Restore-down on MBT's main window.
This lead me to the idea of adding more charts to the three monitors that I was already displaying full screen charts on. I added a total of six additional charts, two more 1/2 screen charts 'underneath' each full screen chart. Now I can minimize any (or all) of the full screen charts to view the 1/2 screen charts underneath...then with just two clicks, restore the full screen chart or charts back up.
The picture shows the six additional charts I added to the monitors after minimizing the three full screen charts (see the left hand set of 3 monitors)... The center column shows the main MBT window in the Restored-up state with it's "Docked" windows...the right hand column shows the three full screen charts Restored-up after clicking Restore-down on the main window.

Adding 'free' screen real estate part III
If you use multiple monitors but find you still need extra desktop space, here's another couple of tricks that can be used...You can expand MBT's main window so that it covers two monitors that are situated vertically in relationship to each other...this opens up screens for other programs to use...
When the main window is in the Restored Down mode, stretch the window so that it covers the two monitors completely - EXCEPT leave just a little desktop space above the window on the upper monitor (see picture 1 below).Then when you click Maximize it will actually 'shrink' to fill just the bottom monitor (picture two)...Clicking Restore Down one more time will expand the main window over both monitors again. If set up correctly and the layout saved, MBT can be closed and will retain this set up the next time you start the program.
This set up seems a little counter intuitive, I know...but it works great for me. I have most of my layout's charts and Watchlists "Docked" in the main window and arranged in such a way that when its Maximized (covering one monitor) I see 6 charts...and when Restored Down (covering two monitors) I see those six charts AND my main watchlists along with other market 'feel' charts also.
You can still have other 'Un-Docked' MBT Windows open (or windows from other programs) underneath on the upper monitor (and/or on other monitors if you have three or more total screens)...The Minimize button still functions normally, sending everything to the task bar...Any"Un-Docked" MBT windows will have their own icon on the taskbar and can be Maximized, Restored Down and Minimized independently of the Main window.
Notes: It does take a bit of adjusting/finagling to properly size and place your docked windows so that the ones you want to see are visible when using the Maximized mode...Also adjust them so that they are not partially cut off or get covered by the right hand and bottom scroll bars.


____________________________________________
Session Color - Vertical lines
2/13/2013 You can add shaded vertical lines to your intra-day charts by using the chart's right click menu item "Session Color" . They can be set to show for any time interval...I use them instead of having the Axis&Grids/Major X and Minor X&Y show on my charts.
The picture below shows two charts - a 2 minute and a 1 minute with session color lines. They are set to be 45 or 46 minutes apart and their color shows up as a lighter shade of blue...

NOTE: If you change to a 3,4,5 or other minute chart, some of the lines won't show up because the time frame can't be divided evenly into the session time used. Session Lines don't work on tick charts.
Copy/paste the code below into the Session Color Property window to get started.
gray3; M,Tu,W,Th,F; 0930-0935// OPEN
gray2; M,Tu,W,Th,F; 1016-1016 // MID MORN
gray2; M,Tu,W,Th,F; 1100-1100 // PRE-LUNCH
gray2; M,Tu,W,Th,F; 1146-1146 //LUNCH - MID DAY
gray2; M,Tu,W,Th,F; 1230-1230 // LUNCH - MID DAY
gray2; M,Tu,W,Th,F; 1316-1316//EARLY-AFTERNOON
gray2; M,Tu,W,Th,F; 1400-1400// MID-AFTERNOON
gray2; M,Tu,W,Th,F; 1446-1446// LATE-AFTERNOON
gray2; M,Tu,W,Th,F; 1530-1530// PRE-CLOSE
gray2; M,Tu,W,Th,F; 1600-1600// CLOSE
_______________________________________________gray2; M,Tu,W,Th,F; 1016-1016 // MID MORN
gray2; M,Tu,W,Th,F; 1100-1100 // PRE-LUNCH
gray2; M,Tu,W,Th,F; 1146-1146 //LUNCH - MID DAY
gray2; M,Tu,W,Th,F; 1230-1230 // LUNCH - MID DAY
gray2; M,Tu,W,Th,F; 1316-1316//EARLY-AFTERNOON
gray2; M,Tu,W,Th,F; 1400-1400// MID-AFTERNOON
gray2; M,Tu,W,Th,F; 1446-1446// LATE-AFTERNOON
gray2; M,Tu,W,Th,F; 1530-1530// PRE-CLOSE
gray2; M,Tu,W,Th,F; 1600-1600// CLOSE
The color/tints of the vertical lines are affected by the number that follows 'gray' in the session lines property window and by the chart background color used.
Their width depends on the times used - for example, use 09:30-1600 to shade the entire major market open. You can also add or delete lines ...
More on Session Colors

MBT Available Studies, Plugins
and Moving Averages
