Besides reinforcing in my mind's eye what I already know works well, I use this page
to document new trade ideas and other things I find interesting.
FuturesTrading Software
Is there a specific place or boards for discussion of trade software?
I'm very satisfied with the features and operation of ApexTrader
but also would like to see what others use and/or recommend.
▶-------------------------------------------------------◀
11/23/23 Coloring and Show Case indicators

05/26/23 Coloring differences but the same basic templates


05/17/23 Differing Stochastic Settings
for different chart templates


05/08/23 Paintbars & Stockastic

%20BlueNaMacH-w-older%20Sto%20settings_.png)


04/03/23
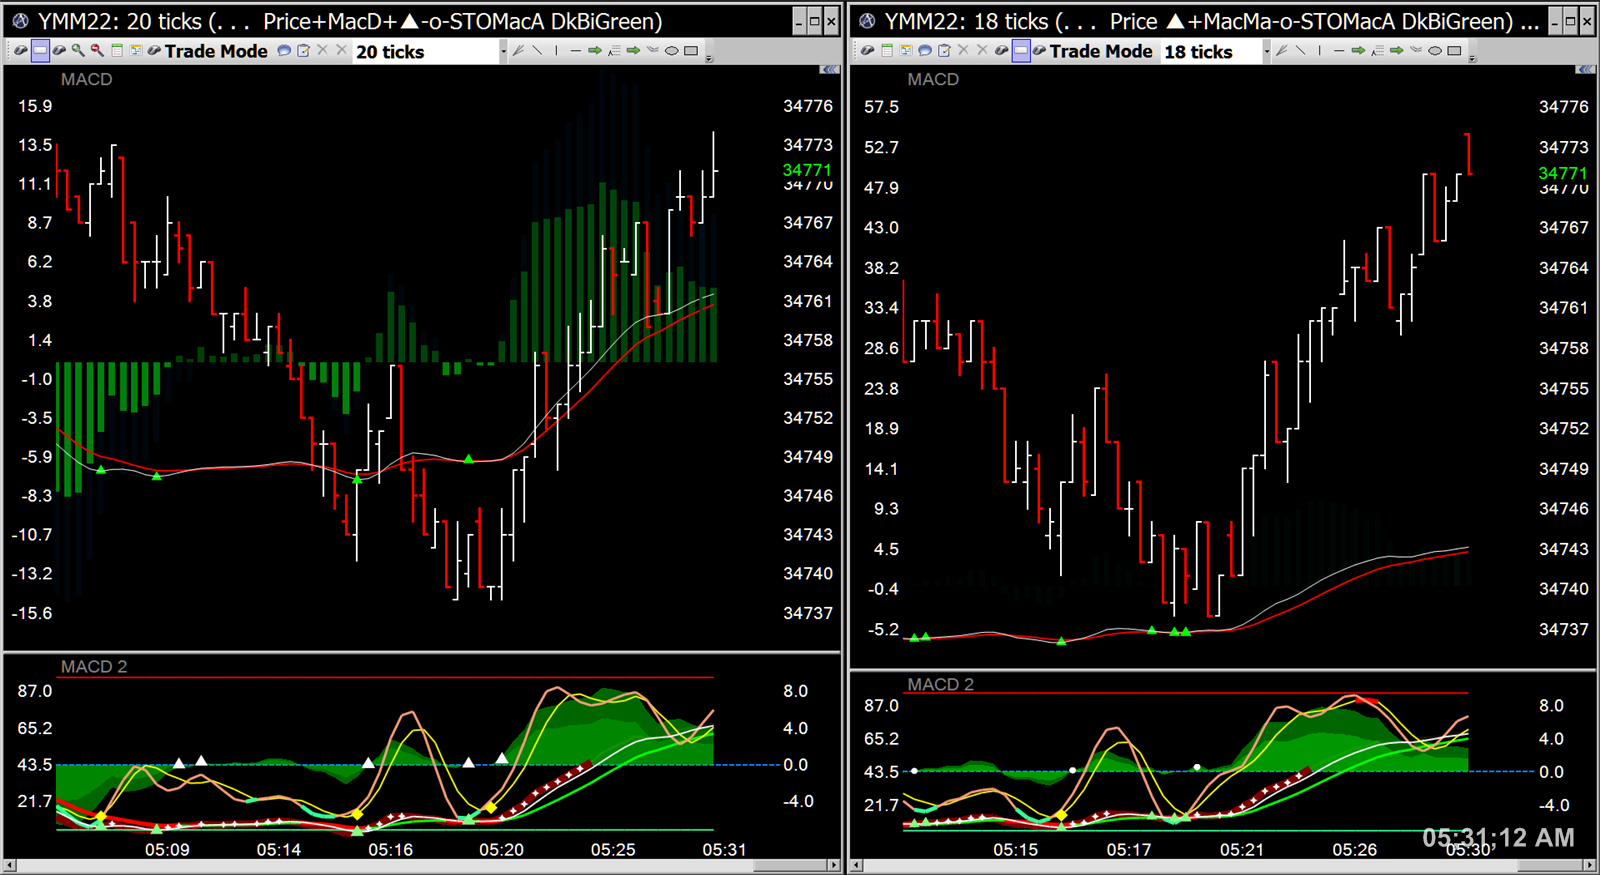
Lime, Yellow & Red paintbars are applied to the price candle outlines which are based
on Stochastic TA...Included in the price pane are two MACD Histograms along with 10 point grid lines.
The study pane has Slow stochastic, Stochastic TA and two MACD Histograms...
There are multiple Custom Coloring and Showcase Indicators applied as well.

03/27/23 Stochastic SignalBars for entry orders

03/20/23 New vs. Old templates

different time-frames with the indicators only and are helpful when engaging in stochastic scalping.


03/15/23 More Paintbar stuff
A slight difference in formulas can change how they print to charts


03/08/23 More on Paintbars

03/03/23 ApexTrader Paintbar Indicators
Design your own & apply to chart templates


01/28/23 Stochastic Buy oversold & Sell overbought

01/24/23 Template with Stochastic
Price pane -- Slow Stochastic %K & %D
Study pane -- Slow Stochastic shown as a histogram with
Stochastic TA %K & %D displayed as lines

(Left chart) Added the Slow Stochastic %K to the study pane for the
(Mac10 Gray -o- TriSto+BiMac) template
(Right chart) Added the oversold lime coloring highlight (STO < 18)
to include both the Slow Stochastic %K and %D in the price pane

01/17/23 Testing a Couple of New Templates
Price pane -- 12;10;26 and 12;7;26 MACD histograms
Study pane -- 12;9;26 and 12;8;26 MACD with Moving Averages
combined with Slow Stochastic and Stochastic TA lines


01/15/23 Modified template and Divergence

12/08/22 Trade Mode chart features

10/19/22 Slight differences in chart templates
Allows for some variety in the layouts
Note - the purple color of the histogram in the price pane is somwhow due to
the Windows 10 computer that runs my new backup TradeStation. The histogram chosen color is actually dark blue (navy) and shows that way on the new SCEPTRE monitors but will show up purple on snapshots that are taken with Gadwin Printscreen, Windows Snipping Tool or the keyboard Print Screen ...

10/05/22 ... the charts are not always perfect
but they're the best we have

09/27/22 More Buy Signal stuff - you can scalp the MICRO DOW 30 albeit small amounts at a time


08/26/22 Stochastic Buy SIGNAL paintbars
Manage orders ... before ENTRIES and after FILLS ... Stochastic Buy SIGNALs fire off very often.
Before -- Watch to how well stochastic Buy Stops are working to determine if the current market is favorable for them
After -- Minimize stop-loss amounts by trailing them up after getting filled


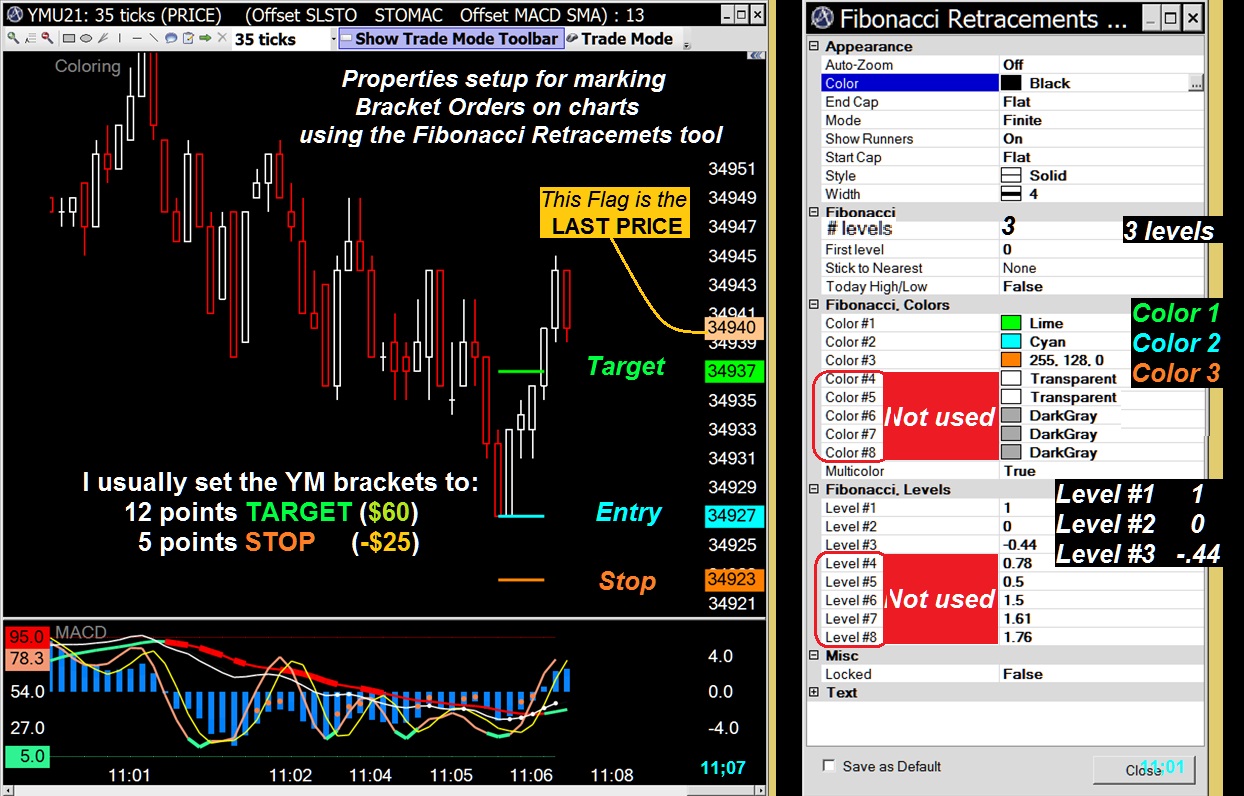
08/02/22 Fibonacci drawing tool properties

07/15/22 Extended order options
 |
| Bracket with Sell Stop |
 |
| Bracket with Sell Target and Sell Stop |
 |
| Bracket with Sell Target and Trailing Sell Stop |
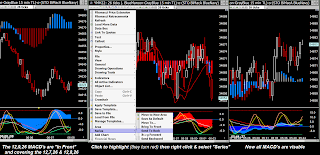
06/07/22 Multiple MACD in the price pane
Certain combinations will have an effect on the primary indicator even when the secondary is set to 100% Transparent.
The primary indicator in the chart below is the 12,7,26 MACD, secondary is the 12,10,26

06/04/22 Dedicated T-Mode monitor

05/25/22 Two New Blue
(templates)

05/22/22 "Custom Indicators"
Coloring and Show Cases
 |
| Besides be able to combine multiple indicators within the same panes on charts you can use Coloring and Show Cases and create formulas that high light certain signals.  |
05/14/22 Slow STO plus MACD with Price

05/08/22 Property settings for templates
With updated versions of ApexTrader software, the right click menu item: Series/Move to function no longer works for combining different indicators into the same chart pane.
While you can still combine certain indicators with price or within the same study, most will open in a separate study pane.
But if you have older Saved to file templates that were created on older versions which have combined indicators, copy/paste their complete .xml name into the new version's Save to file folder. Those can then be Loaded from file into any chart and can be added to the current Save Template list.
(easy peazy simple ... right?)
They can be changed or modified and will display & function properly.
.png)
Another template loaded from an older version's template file:
%20-o-%20StoMacA%20(Teal-9%20DkGreen-8)%20template%20properties.png)
The example above shows a combination of a Stochastic TA and a Slow Stochastic with their scales on the left...The right scale combines a 12;9;26 and 12;8;26 MACD along with a SMA that has been applied to the MACD "fast" moving average
New versions: Combining indicators in the same pane:
1st - high light the indicator (or price) that you want to combine a different indicator with
2nd - select one from the chart's right-click Indicators menu then add it
04/22/22 'Some' of the settings needed to create this template
Many more are in there like candle coloring, right hand margin, text sizing etc. but are not shown


04/19/22 Candlestick outline and body coloring
Template names are shown in the chart's title bar
( . ◓ Teal-Red Candle II+MacA--STO+biMacA Teal )

There are many ways to adjust the chart properties
to show the type, colors and thickness of price:

04/18/22 Tryng Stripe bars

04/14/22 Tri Study Histo Area
Trouble with this new template
Each time ApexTrader is started OR whenever the TriA template is loaded
to a different chart window, I must adjust the Series (send to back)
so that the histograms are in the order I want.

04/13/22 Rules for scalping

04/12/22 New template


03/31/22 Revisit the "Buy-theDips" methodology
Remember way back when the Buying the dips was all the rage?
(remember to manage the trade to minimize stop loss amounts)

...ya don't always make a killin' when buying the dips...
so you take out what you can until you can see what's happening

Sometimes you can make good money when buying dips

03/27/22 Subtle template differences
The right chart template is a copy of the left including all the colors, indicator lists and preferences albeit with minor differences. The MACD histograms in the price study are still there but are set to be 100% transparent and it's scale has been scrolled down to reside in the middle of the price window with a slightly narrower study window plus some of the Showcase indicators are smaller.

03/13/22 No study separator
Stochastic and MACD scales left with Price on the right


03/10/22 Price scale on right or left


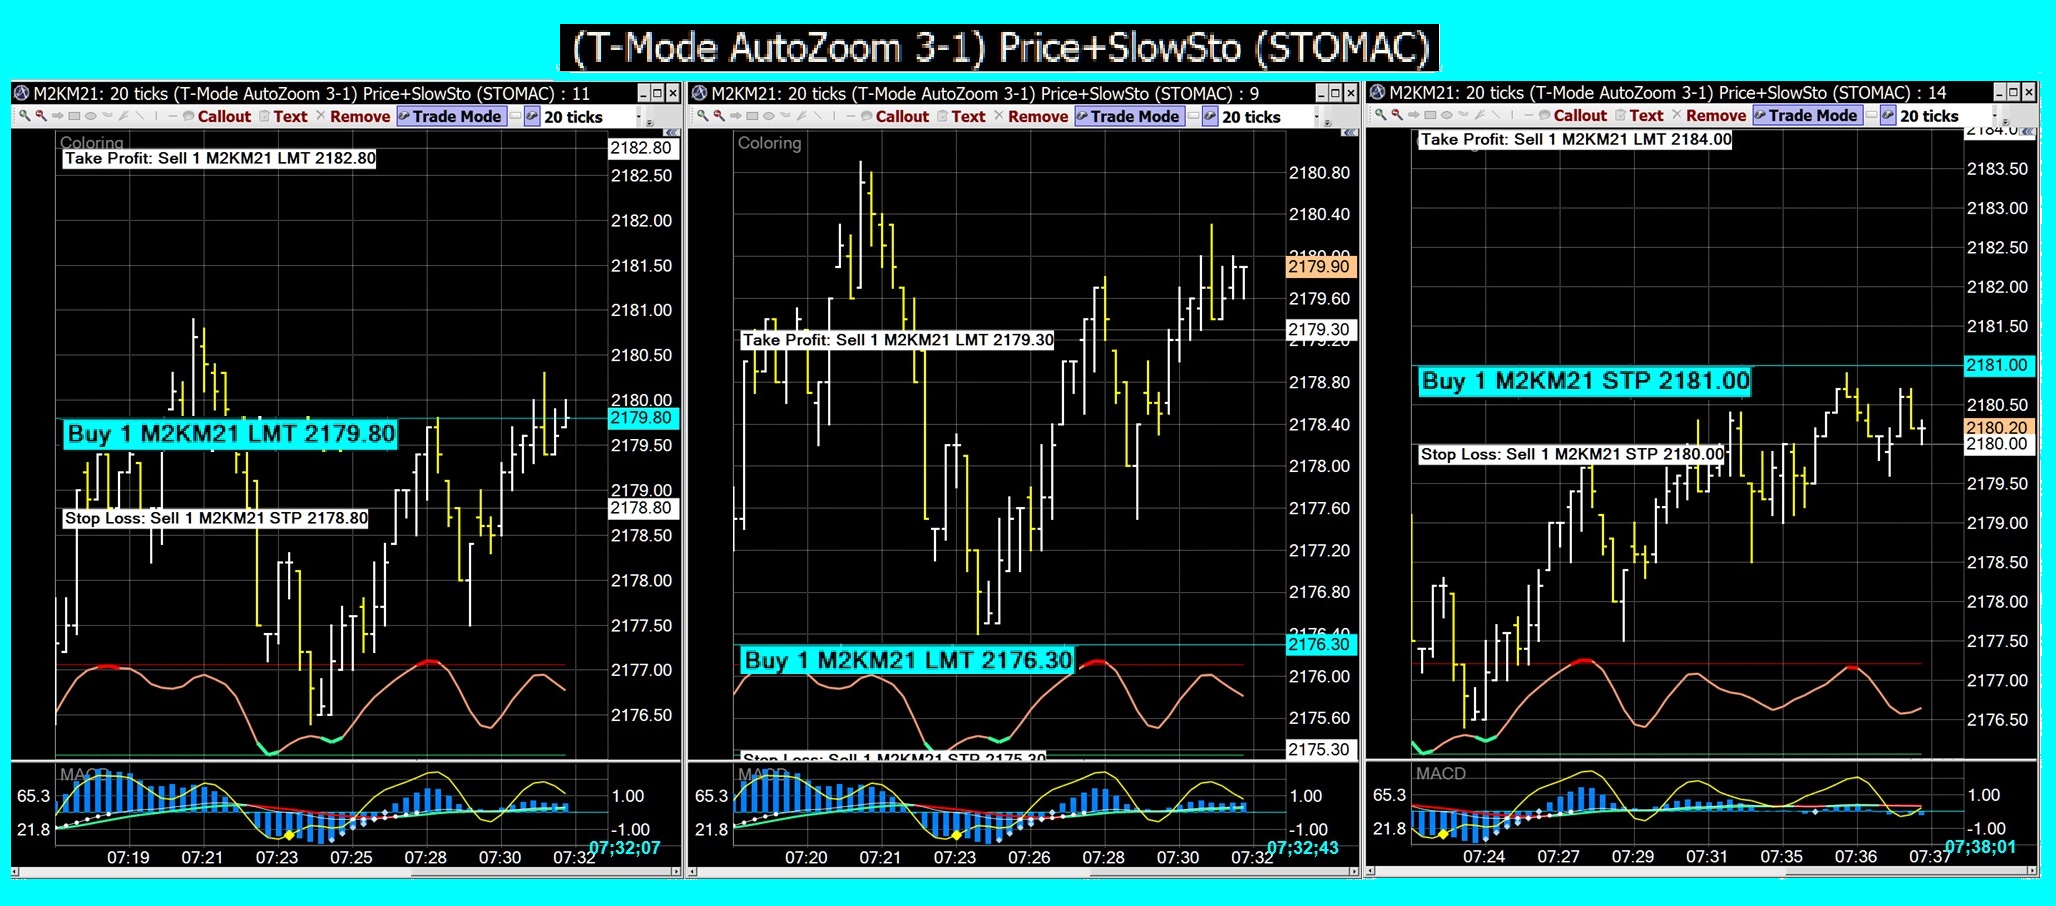
02/22/22 T-Mode chart set up
T-Mode Charts are used for signal spotting ... and for placing orders
Dedicated charts on a single monitor with various templates and widths
that usually display the same ticks-per-bar
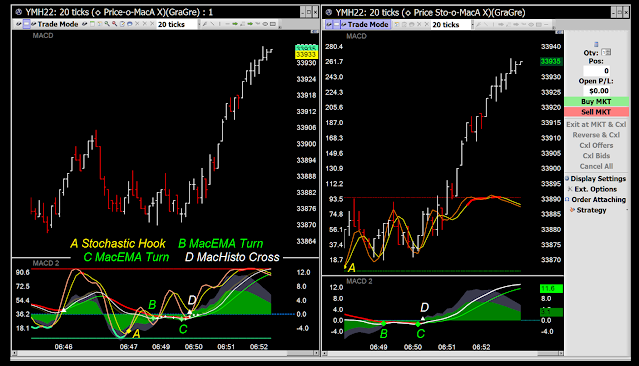 |
| ShowCase Indicators and the formulas that fire them: A - Stochastic Hook... Input<20 & input[3]>input & input>input[1] B - MacEMA Turn...input>input[1] & input<input[4]&input<0 C - MacHisto Cross...Input>0 & input[1]<0 & input>input[2] |
Showase + Coloring Custom Indicators


02/07/22
Renamed templates & new coloring

02/03/22 Cross X Test Trades
"Practice trades" help you ID what the market will bear


02/01/22 1-2 Punch Cross X
Practice trades help you ID when the market is more favorable for runners


01/28/22 MACD EMA CROSS X
ShowCase Indicator

Created 2 templates-- MACD EMA X in the study and in with price

CROSS X
The arrows point out the buy signals from the various indicators
01/26/22 A momentum strategy
Utilize the most common indicators as signal generators --
Price Action, Stochastic and MACD

01/20/22 Multiple histograms and multiple settings
Different property settings can be selected and/or applied to manipulate what shows on charts.
You can use "Displacement" (indicator off-sets) or "Custom indicators" (Coloring or Show Cases) etc.
This example includes many of the tools available from ApexTrader software --
IE: Multiple MACD indicators, multiple Stochastic indicators,
multiple Coloring indicators and a Show Case indicator.
The "Series" properties sets which indicator will be in the foreground or behind.
Here a 2 period "Simple Moving average" is applied to the MACD Main EMA -- which smooths it's shape.
The white dots on this line are created by a "Show Case" indicator
(formula used: Input>input[1]&input<0)
The "Coloring" indicator is applied to the MACD Signal EMA (lime highlight)
(formula used: Input>input[1])


01/12/22 Tri-Histo (Areas) in Study Pane
Different look depending on which histogram is in front of which


12/30/21 Bi-Histo (Areas) in Study Pane
with MACD EMA lines and Bi-Stochastic line indicators.
A single two color histogram (column) is in the price pane

and are using APEXTRADER software :
I can e-mail any of them for your use or study - they should open in your Apex platform exactly as they appear here.
Use the form at the bottom of the Table of Contents
(on the right hand side of this page)
Just copy/paste the .XLM file into your Apex "Save to File" then "Load from File"
Stochastc with price -o- dual MACD histo Areas

Time Frames and chart widths for Perspective

12/29/21 Slightly less busy templates
Removing "visibility" of indicators

12/17/21 Variations on a theme - - templates
Take your pick - which histogram coloring appeals more to your eye?

I'm torn between the Black-Blue & Navy-Blue


12/17/21 STO SCALPING method

12/17/21 ApexTrader software - set-up tips
12/06/21 Zero-ing in for STO BUY STOP scalping
Good for using extremely tight brackets
Like a 6 point TARGET with a 3 point STOP ... for placing trailing BUY-STOP bracket orders.

Stops are usually executed as buy@market...
Stop orders can be stipulated as buy@limit...
but there's no guarantee of a fill because it may be too far back in the order cue...
Also modified a two study template:

12/05/21 Thinking about upgrading my 7 monitor trade station
The six 27" curved screens are great...the 24" 7th monitor is rotated 90º
for use as a Control Panel...Would bigger be better?
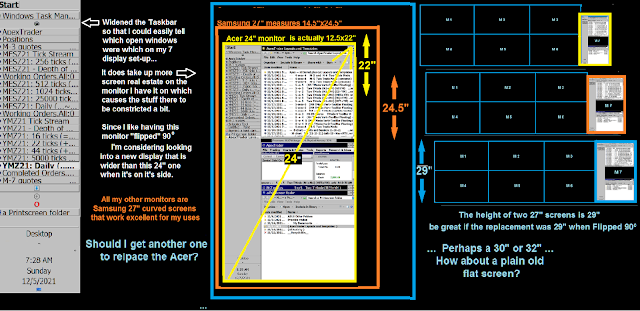
Current trade station set up


Decisions decisions
11/29/21 Slight Changes to a 'regular' Sharpshorts Template

11/26/21 T-Mode Toolbar
Add to wish list

11/21/21 Indicator properties - an example

Each chart's template name shows in the Titlebar...there are some "quirks" with
ApexTrader software but the customization available over-rules my "nit-picks"

Messing with the BLine again
The white line is just a relatively long term stochastic.
Point A highlights an MOF - Slingshot opportunity...

10/28/21 - Hidden windows
Helps in managing available desktop space...windows over windows

10/22/21 So many time frames --- but why? ...PERSPECTIVE...
At a glance you can see what's happening - from the current
session thru the latest few minutes


The right hand monitors house the T-Mode and short term charts.
These templates high-lite the BiHisto's in the price pane:


10/11/21 Keeping the basic templates too

10/06/21 New chart templates

Same as above with a SMA of the (12,8,26) Histogram slope added

Simple Moving Average of MACD Histograms

Screenshot of monitor 5


I use two very short term charts to place, to monitor orders and track position fills.


09/29/21 Apex Version 4.3 is working excellent.
Had to redo all my saved templates - most use the Stochastic TA and Slow Stochastic.
A major plus with 4.3 is that the quote/chart delay is gone.
09/24/21 Well what'a ya know?
....as Rosanne Rosanadana says "never mind"....


09/24/21 Preparing to update the ApexTrader program
My broker introduced a series of updates starting last March (Ver 3.5 thru Ver 4.3).
Although some improvements were included they also eliminated several features
that I've been utilizing for years. One of which is the Stochastic TA indicator.
Figured out a good replacement for it so I'm going to finally download the new version.


09/15/21 Long term and short term templates
Darkened the histograms


09/10/21 New STO scalp templates
I use use two slightly different stochastic indicators provided by my charting software.
The orange line is the Slow Stochastic which is slightly faster to react to
price action than is the yellow Stochastic T/A.
Both lines show only the %D -- the %K lines are transparent.
The left chart shows the Slow Stochastic having an offset of -1
but there is no offset used on the right chart.

Above
Enter trades based on the Slow stochastic over-sold signal (right chart)
Exit trades based on the STO T/A over-bought signal (left chart)
Below
Some more ideas behind the STO scalp method:

09/06/21 Modified Long-Term template
Eliminates all left hand scales

08/31/21 Trade Mode
- On-chart bracket order entry and management -
The left and center charts have Trade Mode enabled, either
can be used
to place or modify orders. The toolbar on the center chart
is covered
by the right hand chart which is set to Stay on Top. These occupy M 4 & M 5.

 |
| I use slightly different time frame charts |
The 6 monitor layout below is shown with all ApexTrader charts & windows...
I have a 7th monitor set up below M 4 and can add more screens
but I'm finding that six 27" curved monitors provides more than enough desktop

08/30/21 Fibonacci Retracement Drawing tool

08/26/21 Indicators on the chart template:

08/25/21 Re-introducing the 2 study chart template
The left chart has the stochastic indicators shown in the price pane.

8/18/21 ApexTrader Version 3.5
Hoping that the updated Version 4.0 is not forced upon me...
I use many of the TA Lib indicators that Version 4.0 eliminates
IE: Stochastic TA and Slow Stochastic, for example:


but it is problematic adjusting it's parameters to match
the Stochastic TA , Stochastic Fast and Slow Stochastic of Version 3.5
8/08/21 Testing Stochastic parameters
ApexTrader was updated last March but so far I've been able to continue running Version 3.5...
Version 4.0 eliminated some of the indicators I've become accustomed to using.
Gone is the entire TA Lib collection which included Stochastic (TA) and Stochastic Fast.


08/06/21 Another "trial balloon" chart template:
 |
| The OHLC Data Row across the top of the 6 hr chart is for the most recent bar. The hi-low lines mark the range for the entire current session. |
07/29/21 An explanation of a template with
"Custom" Showcase & Coloring indicators

time frame 45 tick chart with Right Margin applied.
On the right is a lower 20 tick time frame for placing orders (T-Mode template)
with Trade Mode Toolbar and on-chart Trade Mode applied.
 |
| Scales: LH chart - MACD is on the left, Stochastic on the right Scales: RH chart - Stochastic is on left with MACD on the right |
07/27/21 Fooling around with tools
that are provided by my software
I normally set the Fibonacci Retracement tool to show the Brach Zone levels...
But with a little finagling it can be set up for showing entry and exit bracket levels:
but I'm gonna see if they can be of any utility:

07/22/21 Dedicated T-Mode monitor helps to manage positions
I usually enter new orders on the left hand chart but can trade
or change orders on any window. The center chart setup has
LARGER bracket fonts (easier to grab them with the cursor).

to utilize differing options on each.

06/19/21 Trade Management Chart set up
Both of these charts now reside on my layout. Lately, Price Action has often become
too difficult for me to quickly react to...IE; It may be difficult to line the mouse pointer up
for adjusting the arrows when I want to raise my initial TARGET or STOP level...
(and the bigger fonts help my weakened eyesight)

Another set:


06/17/21 A DIVERGENCE ODDITY
I have just noticed it lately but may have always been happening
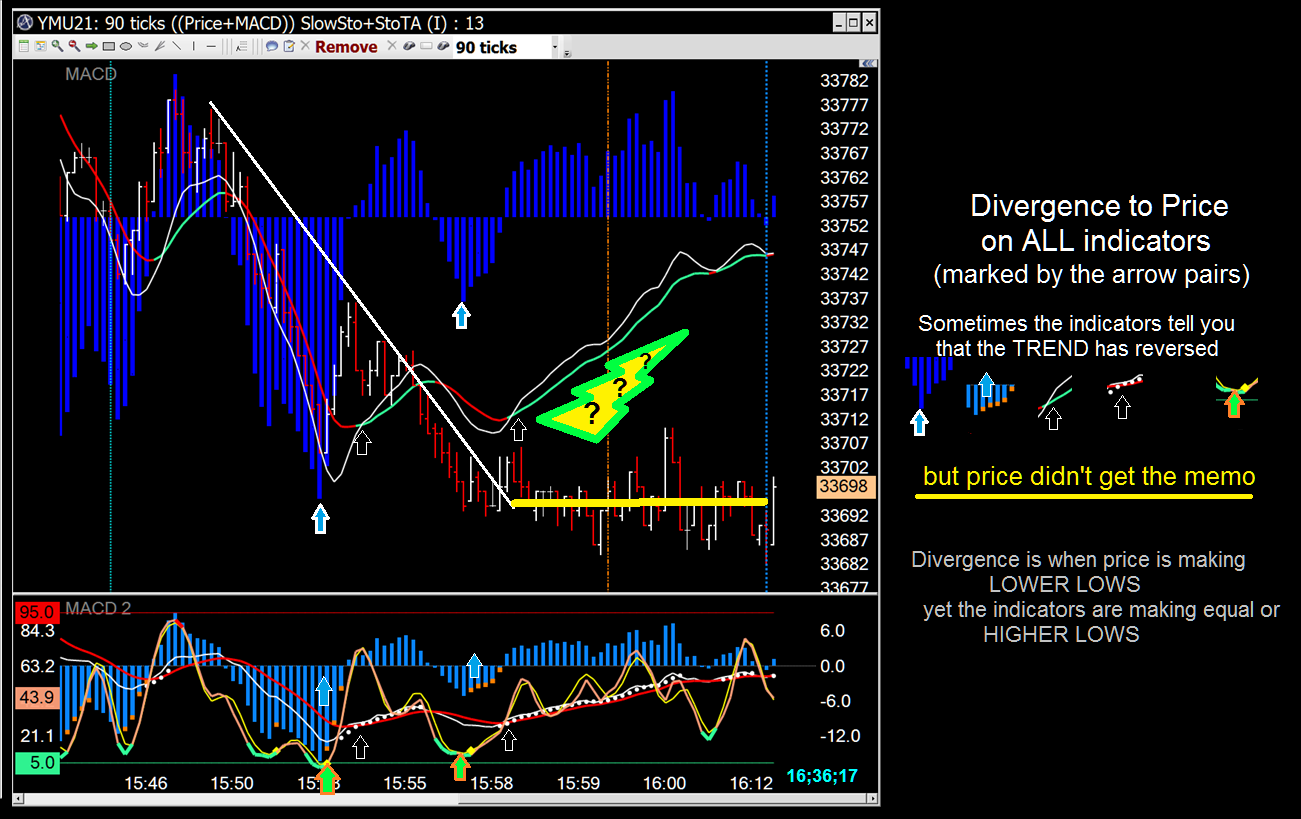
I've always said that divergences can suggest IMPENDING price reversals...
(never said they had to be acted upon immediately)

06/14/2021 Divergence as a leading indication
All indicators are based on price action.
Therefor they follow behind what price has already done...but...
Divergence is the the most reliable indication that can lead.

06/10/2021 Know your charting software

06/03/21 Always use bracket orders

Another example that may have you asking
"why should I use bracket orders???"

because you can't always guess when the run is over
nor how quickly your gain can become a loss
06/03/21 Modified the Price+MACD templates

5/24/21 Time frame perspectives


were not "perfect" but still resulted in a good run up.

5/23/21 It is what it IS - Inverse Slingshot


5/14/21 WHO's ON FIRST?
Relationships between price and indicators around reversal areas...


5/12/21 New Trade Mode template for bracket orders --
the chart will always display the entry level and both closing legs.
All three legs are adjustable before being filled
and the closing legs are adjustable after getting filled.
5/6/21 ApexTrader allows for multiple chart/indicator configurations


5/3/21 New Template - MACD with Price
Now using Slow_Stochastic (Stochastic TA hidden)

04/22/31 Added the 8th monitor back into the array

04/16/21 .. Flipping over the new vertical screen real estate
Monitor 6 is actually the same 24" dimension as the others
but is mounted sideways and a lower resolution is applied.


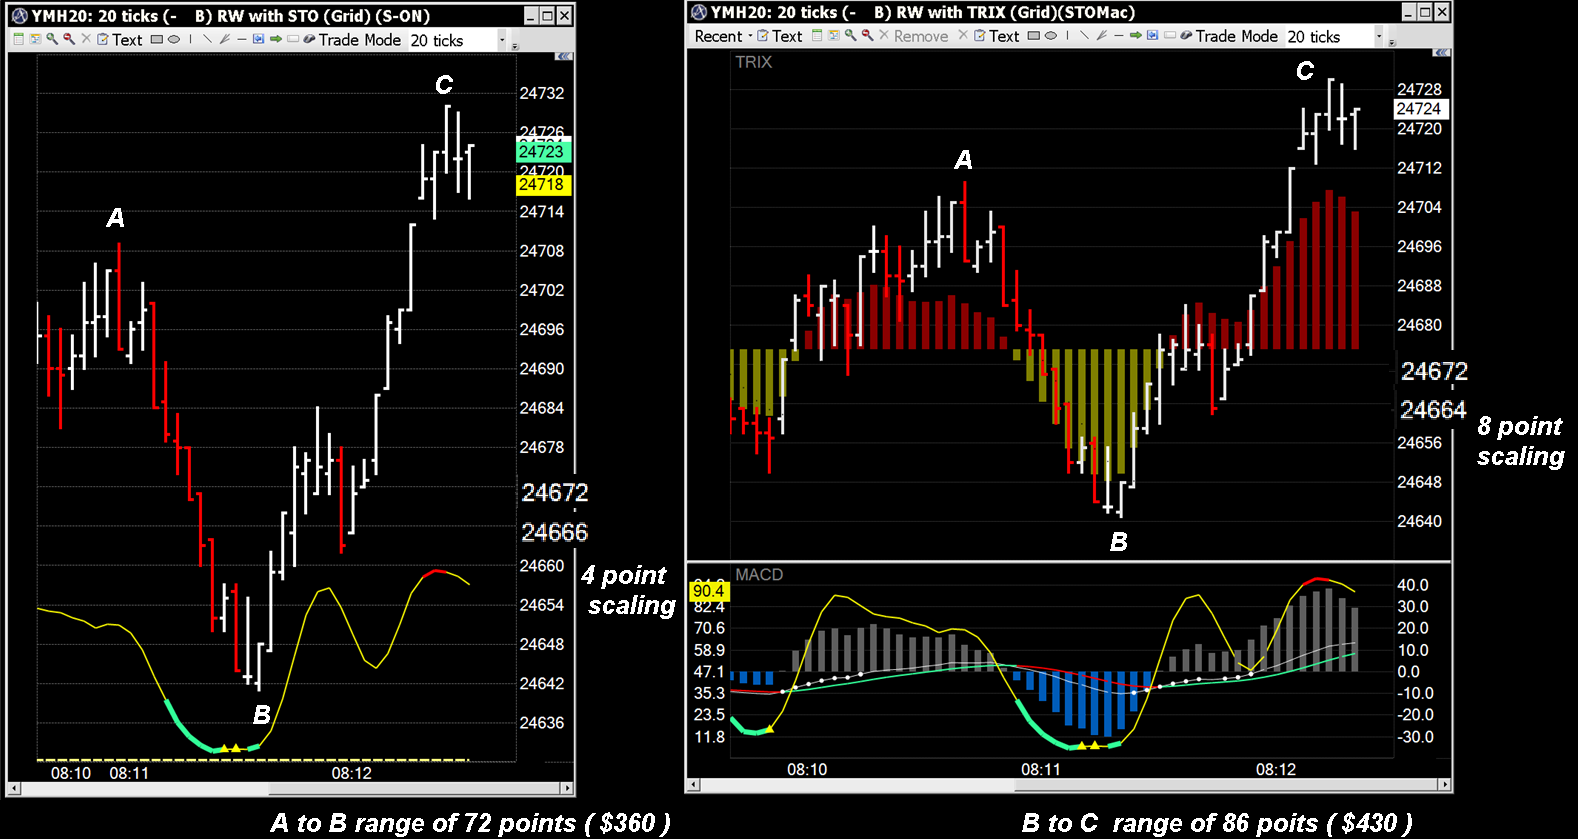
I like viewing two of the same (or similar) tick-per-bar charts with differing
widths...it can be helpful for perspective when deciding to place an order.

In the above example, the right hand chart shows about twice the activity of the left.
Although the indicator parameters are the same on both charts it's
sometimes easier to see price-to-indicator relationships with separate studies.
04/12/21 .. 5 period Linear Regression
applied to 5 period TRIX histogram
This set up enlarges the indicators and ensures they stay contained within the price pane.
Helps understanding their relationship to price action -
especially useful for spotting divergences.
I'm using a -1 bar offset on the LinReg line which makes up for lag...

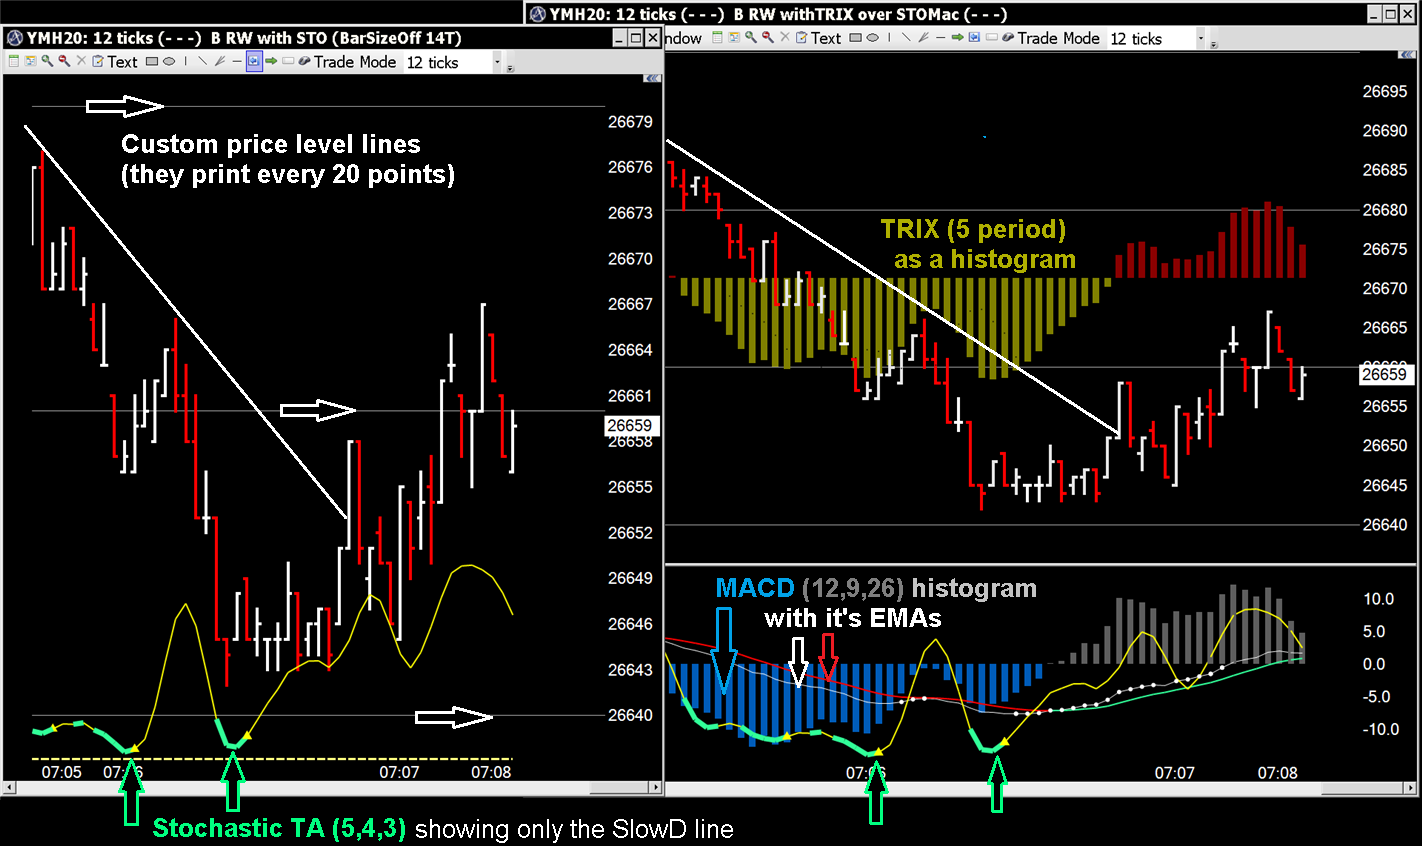
04/07/21 .. Trying to get some use from Linear Regression
In the price pane:
The white line is a 10 period LINEARREG applied to Price (Close)
The Lime line is a 20 period LINEARREG_ANGLE applied to the TRIX histogram (5 period)
In the price pane:
The white line is a 10 period LINEARREG applied to Price (Close)
The Lime line is a 20 period LINEARREG_ANGLE applied to the TRIX histogram (5 period)


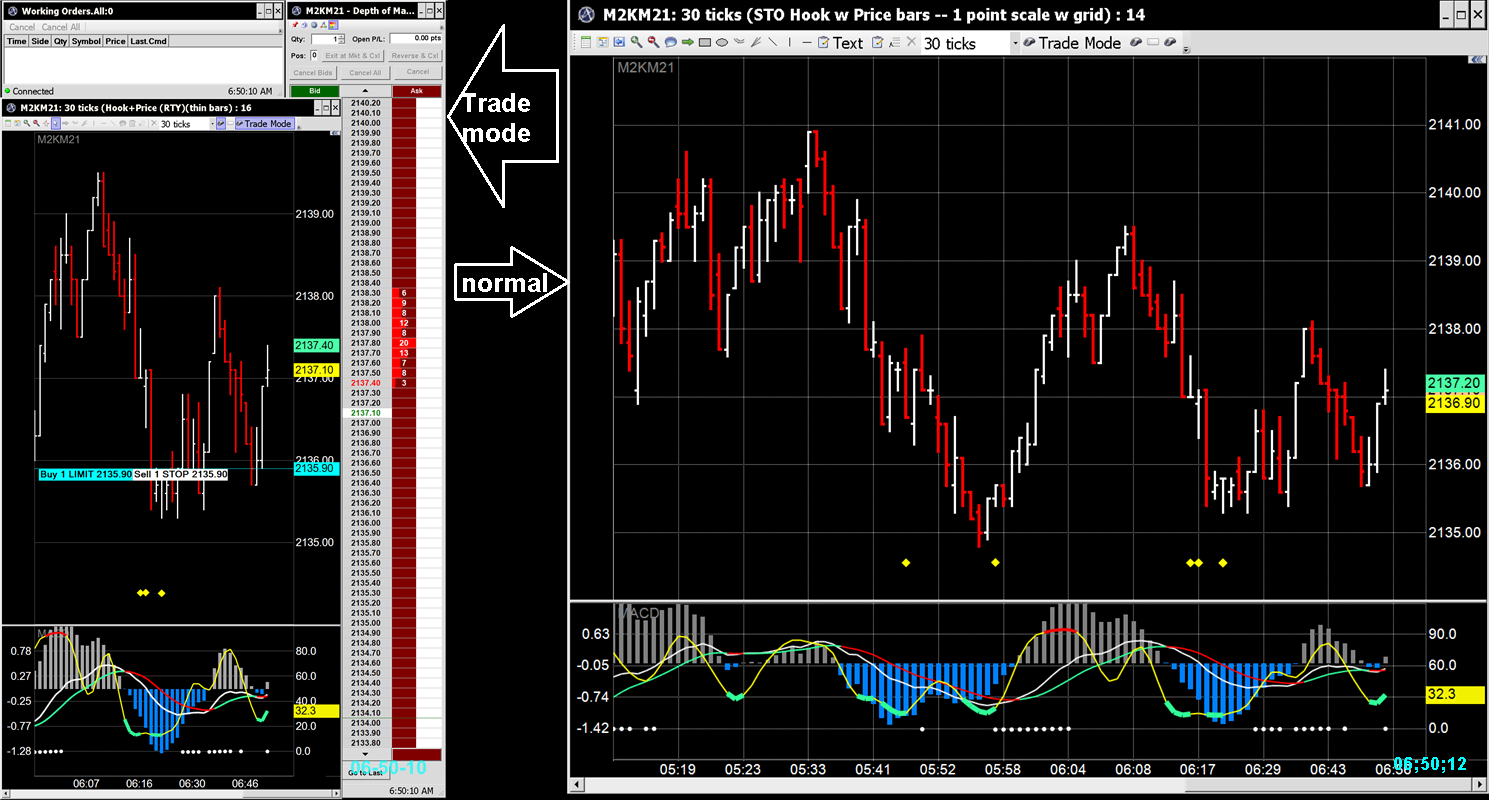
STO HOOK - Yellow diamonds on the stochastic SlowD line
Input< 20 & input[3]>input & input>input[1]
POS Mac DOTs - White circles on the MACD EMA 'fast" line
Input>input[1] & input<0
TRIX TURN - Lime triangles on the MACD histogram center-line
Input< 0 & input>input[1] & input<input[4]


▶-------------------------------------------------------◀
03/28/201 ... Some ApexTrader tools


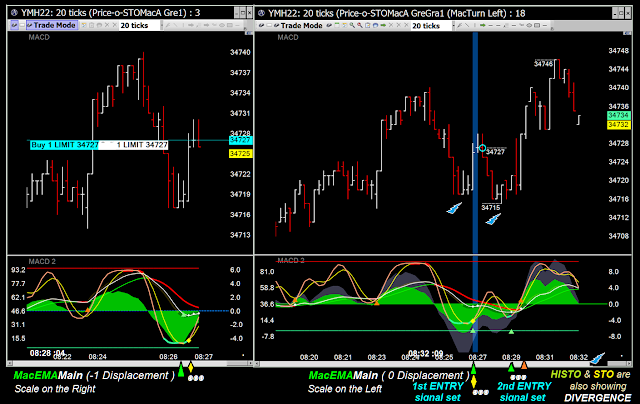
03/25/2021 ... Latest trade setup
I flipped my Trade Mode monitor 90 degrees in order to "zoom in"
on my T-Mode chart and to enable the DOM to show more range.
(LH chart - 90º monitor...RH chart - normal orientation monitor)
12/20/20 ... ES E-mini Micro
Left - Entry chart with 5 pt target & 2 pt initial stop brackets
with trade mode toolbar enabled for add'l order control.
Right - Same ticks/bar for a longer term view and exit chart.
Right - Same ticks/bar for a longer term view and exit chart.

03/10/2020 --Two same ticks-per-bar charts
The price action is the same on both
but viewing different sized charts and templates can help your
perspective and quickly getting a "feel" for current market "pace"
03/04/2020 My T-Mode charts
Same tick interval but different templates...the different chart sizes
are like seeing multiple time frames on the same screen.

03/03/2020 My indicators:
02/27/2020
Seeing patterns and placing the order:


02/10/2020

An example of 3-INDICATOR-REVERSAL patterns across 3-TIME-FRAMES
Some PULL BACKS work better than others for entries

12/30/2019
Discovered a way to add ALL the indicators I use to the price pane
thus eliminating the need for study panes. This saves chart "real estate"...

A couple of different configurations:


12/16/2019 New Templates
Left -- Stochastic with price over Full MACD
Right -- MACD histo with price over stochastic & Mac EMAs

...how do you like your MACD displayed?

I'm liking it as a Step Line"


12/14/2019
Trade Brackets
When placing bracket orders, the system will automatically
place offsetting orders -- (one fill cancels the other).
Save different offset profiles to different chart TEMPLATES.

After an order is executed you can adjust either offsetting order...
Or cancel either side or both sides. You can also
EXIT-at-Market & Cancel
12/10/2019
Added TRIX Histogram with Price
I've figured out how to eliminate the space that used to show
on the left hand side: it seems that if I applied
the Custom Indicator - Colorize
for either the positive or negative histo it required setting
Show Left Axis to Values or PnL ... if None was selected
both left and right scales would screw up.

12/06/2019
ApexFutures provides ApexTrader
with an infinite number of ways to configure the charts:


12/04/2019 Enabling the Data box
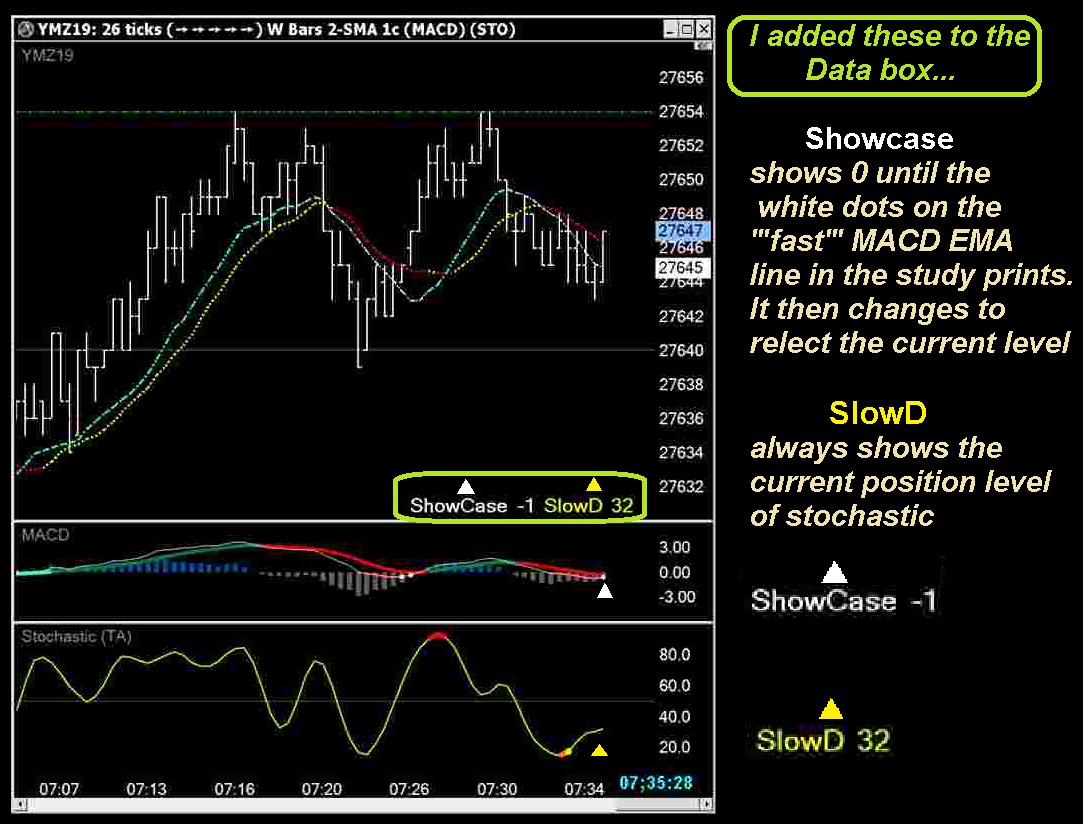
Am considering if using the SMA turns as the ENTRY signals
after other quicker signals print is a better strategy.

12/02/2019
Added 2 SMAs to the new 2 study templates
Combination of signals that often happen leading to a good
"bits-and-pieces" trade ... Divergence then a Trend Line Break then
price pulls back as the SMAs and Mac EMAs rise.
A Money-on-the-Floor price pattern forms
then Stochastic Hooks away from Oversold.

11/26/2019
2 new 2 study templates

11/14/2019
MACD "fast" line trend
Green colorized price bars and white MACD dots in the study


A way to use MACD EMA and Stochastic %D lines
to rationalize trading potential reversals

Saving the templates to the software package

9/25/2019 Divergences
Divergences abound...but may not align perfectly across time-frames
Differences are high lighted:
3xD at points 1 and 2 on the 180 tick chart (histograms, EMAs, stochastic)
2xD at points 3 and 4 on the 600 tick chart (histograms, stochastic)
Differences are high lighted:
3xD at points 1 and 2 on the 180 tick chart (histograms, EMAs, stochastic)
2xD at points 3 and 4 on the 600 tick chart (histograms, stochastic)

6/14/2019
Quick scalps
Use a limit+bracket order, as close to the low or midpoint of the bar
after the signals print...it does take some concentration to accomplish.
These examples show 4 trades - only #2 would have been stopped out...

These patterns print so often, in every session that you do not need
to be glued to your trade station all day in order to take advantage of them.

6/7/2019
Floating indicators

03/22/2019
2 new candlestick templates with slight variations available for download via email
Left hand ➙YM RBL Candles) MacH+SmaTurn (PB
Right hand ➙YM RW Candles) MacH+SmaTurn+PB (EMA Dots

03/12/2019
New Colorizing and Show Case tools added to my old basic chart template.

03/07/2019
STO and MacEMAs

02/23/2019
YM has retraced 100% of December's drop and is leading
the other FUTs. Next target is the previous all time high.
Stochastic is overbought suggesting a near-term pull back. MACD EMAs are strong.

