I use the available tools to customize charts that tell me what I want to know. This page describes
in detail some of the combined components that can be applied to any particular template.
These two charts use the same template. Switch between the MACD histogram (left)
or a TRIX histogram (right) simply by toggling the Visible feature from On to Off.
(All Active Indicators list ► MACD (11,9,26) ► Properties ► Visible On/Off)
All of the charts on this blog contain elements of those that are shown below.
This one is a T-Mode chart template with it's All Active Indicators list.
The properties windows for each of the individual indicators follow below.
(The TRIX indicator will not be shown unless the MACD (11,9,26) Visible is turned to Off )
A - in the PRICE pane
Displaying just the MACD (11,9,26) Histogram
B - in the PRICE pane
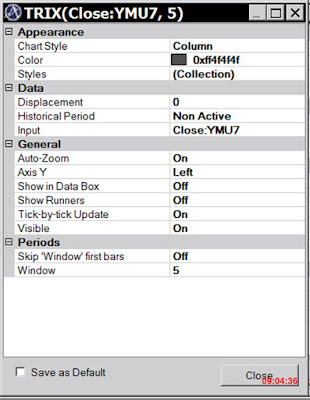
Displaying just the TRIX(5) Histogram
C - in the PRICE pane (Coloring)
Color of the TRIX histogram when it's below zero
D - in the PRICE pane (Show Cases)
E - in the PRICE pane (Coloring)
Orange color when the WMA(6) of the MACD Main EMA trends down
F - in the PRICE pane (Coloring)
Lime color when the WMA(6) of the MACD Main EMA trends up
G - in the PRICE pane (Coloring)
Color of the negative price bars
H - in the PRICE pane
Configuration of price
I - in the PRICE pane
The WMA (5) of the MACD Main EMA to which trend colors and dots are applied
J - in the PRICE pane (Coloring)
Color of the MACD histogram when it's below zero
K - in the PRICE pane
Not Visible - this is used to center the TRIX histogram within the price pane
L - in the STUDY pane
Another MACD histogram (12,9,26) - this one is displayed as an 'Area' instead of 'Columns'
Note that its Signal line is also displayed
M - in the STUDY pane (Show Cases) (transparent - not visible)
This is to add space on the right side of the chart
N - in the STUDY pane
The Stochastic TA SlowD line
O - in the STUDY pane (Coloring)
Color of the Stochastic Slow D line when it's less than 15 and trending up
P - in the STUDY pane (Show Cases)
White dot on the Stochastic Slow D line when it's value is less than 25
and has changed from trending down to up
Q - in the STUDY pane (Coloring)
The color of the WMA (4) of the MACD Signal EMA when it is trending up
R - in the STUDY pane
The WMA (4) of the MACD Main EMA to which the positive trend color is applied
This is how I set up the title bar and the tool bar...I display these on every chart.
You can choose to add or delete individual toolbar command icons on a per chart basis.
You can dock them to the top, sides, bottom or undock them inside or outside
of each chart. You can easily toggle each toolbar between hide or show.
Chart window configuration adjustments - background colors, grids, X/Y axis etc.
I use custom horizontal & vertical price scale lines using the tools described above...
Know your software features, know where them and how to find manipulate them.


