Besides reinforcing in my mind's eye what I already know works well, I use this page
to document new trade ideas and other things I find interesting.
Questions or comments?...Contact me at sharpshorts2000@yahoo.com
My trading jargon...Click this link for definitions of the terms and abbreviations I use.
▶--------------------------------------------------------◀
12/28/2018 The MACD EMA TURN
The markets have been very volatile lately -- fast action with wide ranges.
I've been keying on the MACD EMAs for entering trades...
in particular, watching MacTurn prints: ♦

 This link goes to a post made on iHub -- an 8 trade, 12 minute period of opportunity...
12/07/2018 Another new chart template...
Acceleration/Deceleration Oscillator

10/25/2018 Another new chart template...

10/06/2018
The title bar is the Template -- explanation:
 The explanation is describing the attributes for the left hand chart. The right hand chart
has some differences thus it has it's own template title. My layouts display different
templates for different time frame charts but all the indicator parameters are very similar.

These show my current "Apply Template" list with some of the templates applied on
different time frame charts. They are saved within the software itself but can also be saved
as an .xml file on my machine which can be emailed to other users who run ApexTrader.


09/17/2018
Noticed this anomaly...
 8/29/2018
Different templates for different time frames but the same indicators arranged differently
 Some of the APEXTRADER chart tools I use

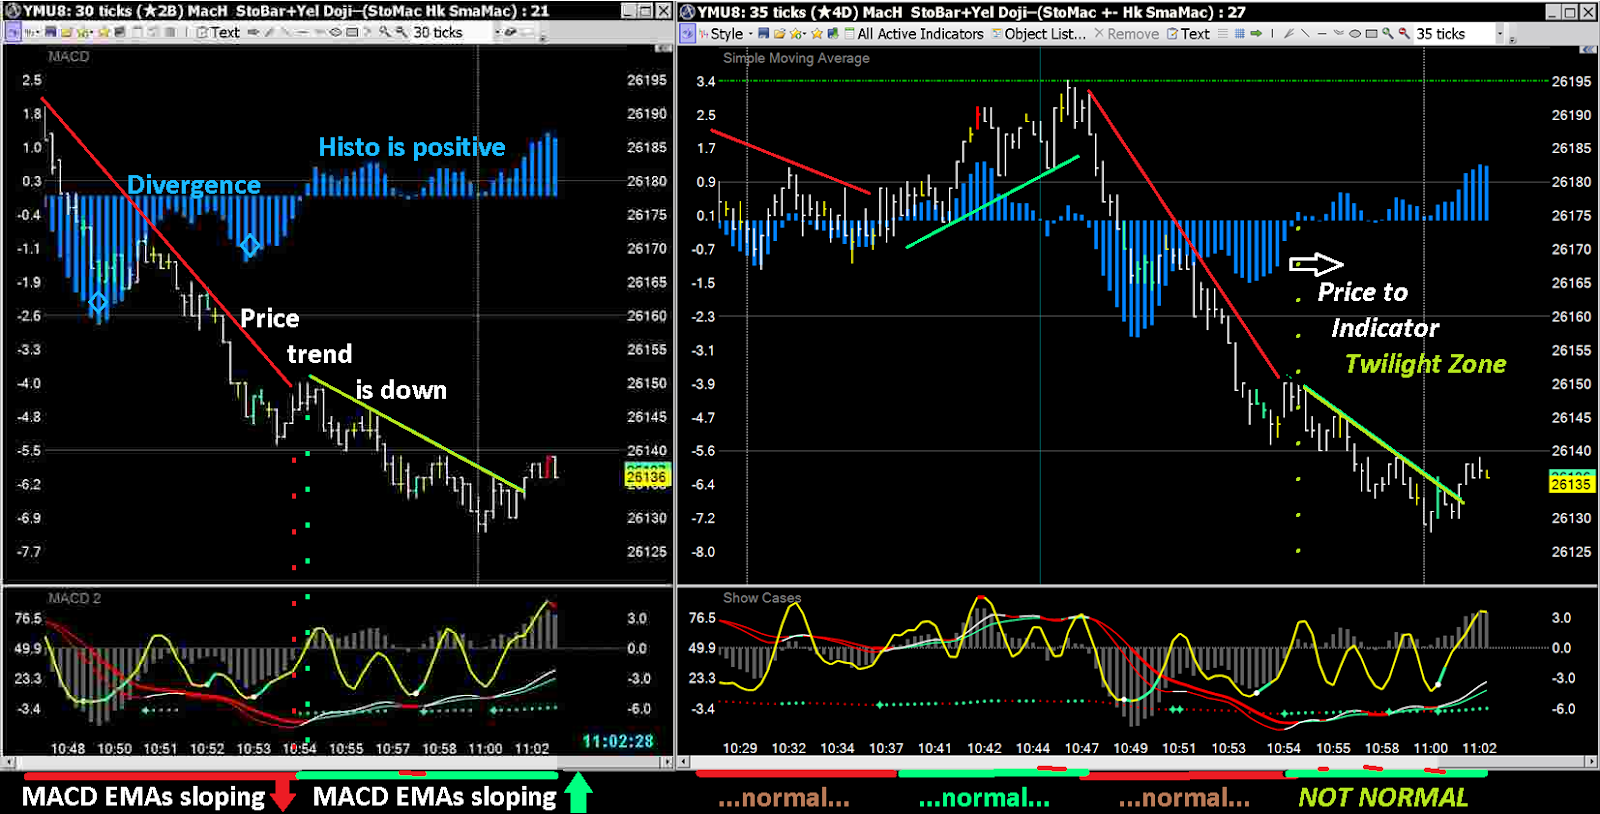
8/08/2018...A favorite set of ENTRY signals
Constantly repeating reversal patterns
This example combines many of the Price Action and indicator signals I use to take bits-and pieces
out of the markets...the shorter term the chart, the more frequently they repeat

07/26/2018 - Customizing the indicators
Applying different moving average types to standard indicators can smooth them out a bit
without significantly changing their 'signaling' shapes.
In the price pane - a standard MACD histogram (12-9-26) along with its Signal EMA.
In the 1st study - 3 period SMA applied to the MACD histogram (4 period SMA EMAs).
The yellow line is a custom Stochastic Indicator showing the SlowD (5 - 3 SMA - 3 SMA).
In the 2nd study - MACD with a 5 period (Linear) Least Square MA of the Stoch SlowD.

06/08/2018...Good month so far
This is how I keep track of my trading activity on a daily basis.
Across the top are the cumulative numbers for all trade results since 2013.
Each trade and its results are recorded on the left. On the right are the
statistical summaries that are automatically updated as data is added on the left
 Along the bottom are tabs for the other workbooks I use to analyze my trading.
For details see step 1 in the Table of Contents - STATISTICS & Spreadsheets
Ignoring your statistics will lead you to ruin
▶-------------------------------------------------------◀
06/03/2018...1st session of June
A 'rare' gap Open following Fridays' excellent jobs report
...I'm still trying to figure out what time is used for the "Prior Settle" statistic...
Most days it looks like it's the 4:15 PM session break but on other days, not so much...

▶-------------------------------------------------------◀
05/30/2018...Was yesterday just a big head fake?
Right back into the consolidation channel today...

-- instead, a new possibility --
 05/11/2018...News and market action
****Closing a week of "good" news****
3 American citizens released by North Korea and 5 major terrorist leaders captured in Syria
****The "bad" news on the TA front****
Stochastic is over-bought and candles look very much like just before last month's reversal

▶-------------------------------------------------------◀
04/13/2018...REMINDER !
Don't let a good day turn against you. Be alert, the world needs more lerts.
Quit while you're ahead, hit 'em and run, know when to say when...
Link to current day's trades Apr 2018
 Trading can be a constant battle between your greed and yourself...
▶-------------------------------------------------------◀
04/22/2018... MACD and LSMA Indicator Combinations
Applying a Least Square Moving Average to your standard indicators can "smooth" them out
(without significantly altering their original relationships with prices)
 04/09/2018...Multiple applications of the Least Square MA


Below - very similar to the template above except that 2 LSMA lines and LSMA histogram
are with price...the study contains the MACD+EMAs with a LSMA applied to STO (hidden)
 04/03/2018...Added an LSMA of STO%D
In the price pane there is a blue "Step Line" LSMA (parabolic) along with MACDh and its Signal line.
The red--lime line in the study pane is an 8 period Least Square Moving Average (linear)
which is based on the input from the yellow Stochastic TA %D...
The white dots print when the LSMA first turns from down to up.
 04/03/2018...MACD with Least Square Moving Ave
The light blue histo in the price pane is a 6 period LSMA of the darker blue MACD histo

 The LSMA can also be displayed as a Line, a Step Line or a histogram...
I'm experimenting with those display types along with other periods

 Here the MACD color is set to transparent with the LSMA shown as a histogram

▶-------------------------------------------------------◀
03/29/2018... MacH vs Awesome Oscillator
Price OHLC with MACD histogram (12,9,26) over a combined study including
Stochastic slowD (5,3,3), MACD EMAs (12,9,26) and Awesome Oscillator (5,10) histogram.

03/11/2018...2 TRIXh w Price

03/09/2018... Divergence types
In depth descriptions are on pages 2, 2a and 2b in the table of contents on the right...

02/22/2018 -- Keltner channels (2.1 deviations)
Left chart - Keltners+center band...Right - Keltners+MACD histogram
 T-Mode 2 study with Keltner Channels on the left...Longer term 1 study with Keltner channels
and MACD Histogram plus MACD Signal line
Also added horizontal level lines, aligned with the MACD scale on the right
 T-Mode 1 study with Keltner Channels and Stochastic...
Slightly longer term 1 study with Keltner channels
 Same T-Mode chart with different templates applied
 ▶-------------------------------------------------------◀
01/24/2018 -- Some T-Mode chart template modifications
 Single study -- MACD with price over Stochastic
 2 study -- MACDh w price over Stochastc over MACD
1 study -- Stochastic over MACD
 ▶-------------------------------------------------------◀
01/13/2018 -- impressive start for the new year

01/02/2018 -- odd trading ranges today...


11/11/2017...Testing the Acceleration/Deceleration Oscillator & AC HOOK
Perhaps good for taking multiple, very small scalps using a Buy-Stop above the bar
 Here's a combo of the STO, MACD EMAs and APO
 Another combo - STO, MAC Signal and AO

11/3/2017...New Multi-study Templates
Eliminates the scales on the left hand side...

NOTE - These two templates DO NOT save properly after shut-down//restart
or when loading either one to an open chart...
(the TRIX remains in the Active Indicators property box but it reverts to just a line on the chart)
In order to get TRIX added without the LH scale, you need to right click the pane that you want
it shown in, select "Indicators" and then uncheck the "Create New Area" box.
12/28/2018 The MACD EMA TURN
The markets have been very volatile lately -- fast action with wide ranges.
I've been keying on the MACD EMAs for entering trades...
in particular, watching MacTurn prints: ♦


12/07/2018 Another new chart template...
Acceleration/Deceleration Oscillator

10/25/2018 Another new chart template...

10/06/2018
The title bar is the Template -- explanation:

has some differences thus it has it's own template title. My layouts display different
templates for different time frame charts but all the indicator parameters are very similar.

These show my current "Apply Template" list with some of the templates applied on
different time frame charts. They are saved within the software itself but can also be saved
as an .xml file on my machine which can be emailed to other users who run ApexTrader.


09/17/2018
Noticed this anomaly...
Different templates for different time frames but the same indicators arranged differently


8/08/2018...A favorite set of ENTRY signals
Constantly repeating reversal patterns
This example combines many of the Price Action and indicator signals I use to take bits-and pieces
out of the markets...the shorter term the chart, the more frequently they repeat

07/26/2018 - Customizing the indicators
Applying different moving average types to standard indicators can smooth them out a bit
without significantly changing their 'signaling' shapes.
In the price pane - a standard MACD histogram (12-9-26) along with its Signal EMA.
In the 1st study - 3 period SMA applied to the MACD histogram (4 period SMA EMAs).
The yellow line is a custom Stochastic Indicator showing the SlowD (5 - 3 SMA - 3 SMA).
In the 2nd study - MACD with a 5 period (Linear) Least Square MA of the Stoch SlowD.

06/08/2018...Good month so far
This is how I keep track of my trading activity on a daily basis.
Across the top are the cumulative numbers for all trade results since 2013.
Each trade and its results are recorded on the left. On the right are the
statistical summaries that are automatically updated as data is added on the left
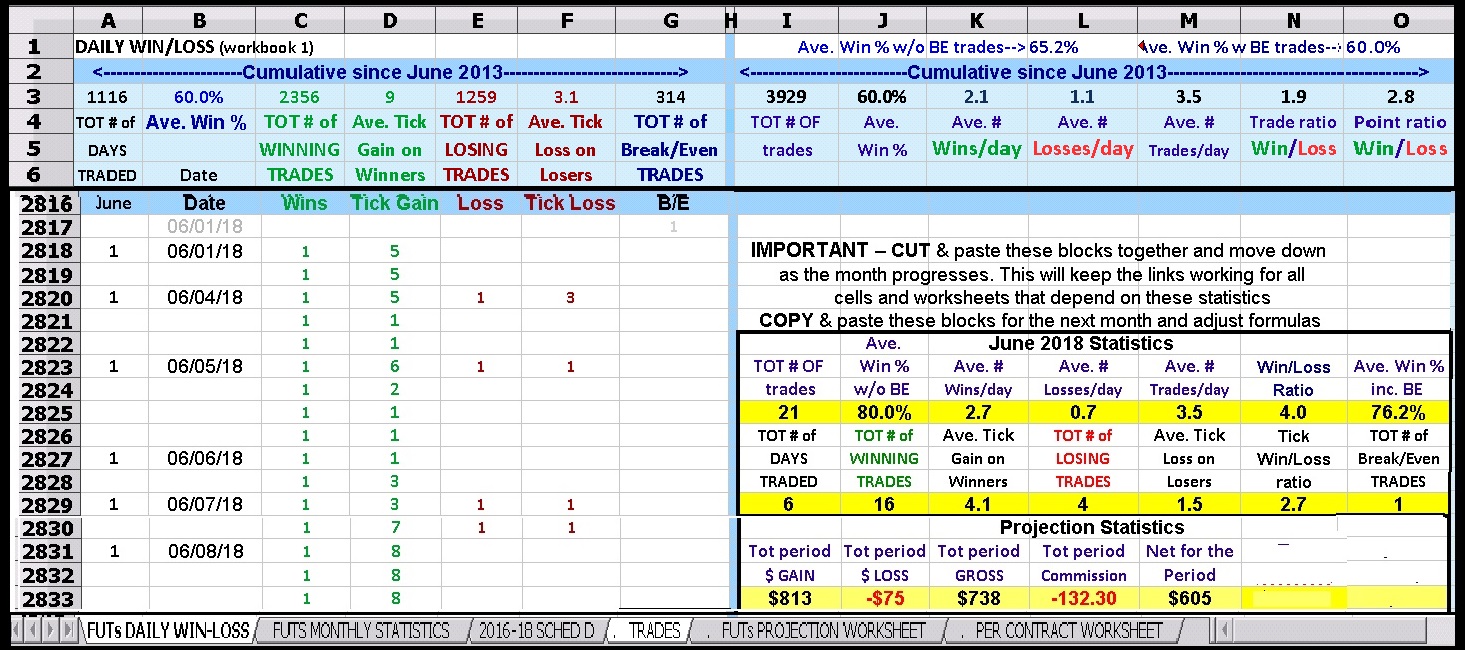
For details see step 1 in the Table of Contents - STATISTICS & Spreadsheets
Ignoring your statistics will lead you to ruin
▶-------------------------------------------------------◀
06/03/2018...1st session of June
A 'rare' gap Open following Fridays' excellent jobs report
...I'm still trying to figure out what time is used for the "Prior Settle" statistic...
Most days it looks like it's the 4:15 PM session break but on other days, not so much...

▶-------------------------------------------------------◀
05/30/2018...Was yesterday just a big head fake?
Right back into the consolidation channel today...

▶-------------------------------------------------------◀
5/18/2018...Last week's reversal speculation hasn't happened -- instead, a new possibility --

****Closing a week of "good" news****
3 American citizens released by North Korea and 5 major terrorist leaders captured in Syria
****The "bad" news on the TA front****
Stochastic is over-bought and candles look very much like just before last month's reversal

▶-------------------------------------------------------◀
04/13/2018...REMINDER !
Don't let a good day turn against you. Be alert, the world needs more lerts.
Quit while you're ahead, hit 'em and run, know when to say when...
Link to current day's trades Apr 2018

▶-------------------------------------------------------◀
04/22/2018... MACD and LSMA Indicator Combinations
Applying a Least Square Moving Average to your standard indicators can "smooth" them out
(without significantly altering their original relationships with prices)


Additional templates with MACD and LSMA combinations

Below - very similar to the template above except that 2 LSMA lines and LSMA histogram
are with price...the study contains the MACD+EMAs with a LSMA applied to STO (hidden)

In the price pane there is a blue "Step Line" LSMA (parabolic) along with MACDh and its Signal line.
The red--lime line in the study pane is an 8 period Least Square Moving Average (linear)
which is based on the input from the yellow Stochastic TA %D...
The white dots print when the LSMA first turns from down to up.

The light blue histo in the price pane is a 6 period LSMA of the darker blue MACD histo


I'm experimenting with those display types along with other periods

Other variations - colorized MACD histo with LSMA as a Step Line


▶-------------------------------------------------------◀
03/29/2018... MacH vs Awesome Oscillator
Price OHLC with MACD histogram (12,9,26) over a combined study including
Stochastic slowD (5,3,3), MACD EMAs (12,9,26) and Awesome Oscillator (5,10) histogram.

03/11/2018...2 TRIXh w Price

03/09/2018... Divergence types
In depth descriptions are on pages 2, 2a and 2b in the table of contents on the right...

02/22/2018 -- Keltner channels (2.1 deviations)
Left chart - Keltners+center band...Right - Keltners+MACD histogram

and MACD Histogram plus MACD Signal line
Also added horizontal level lines, aligned with the MACD scale on the right

Slightly longer term 1 study with Keltner channels


01/24/2018 -- Some T-Mode chart template modifications


1 study -- Stochastic over MACD

01/13/2018 -- impressive start for the new year

01/02/2018 -- odd trading ranges today...


11/11/2017...Testing the Acceleration/Deceleration Oscillator & AC HOOK
Perhaps good for taking multiple, very small scalps using a Buy-Stop above the bar


11/3/2017...New Multi-study Templates
Eliminates the scales on the left hand side...

NOTE - These two templates DO NOT save properly after shut-down//restart
or when loading either one to an open chart...
(the TRIX remains in the Active Indicators property box but it reverts to just a line on the chart)
In order to get TRIX added without the LH scale, you need to right click the pane that you want
it shown in, select "Indicators" and then uncheck the "Create New Area" box.

10/14/2017...Time Based vs Tick Based
These comparisons illustrate why I prefer tick charts for viewing very
short term price action. It's difficult to correlate the different chart types...


09/26/2017...Add'l T-Mode template
TRIX histogram in with price over Stochastic, with dual MACD's and EMA-MAC triangles

The MACD histograms alternate being 'on top' every other time the program is opened.
You can switch their positions using the Series menu.


0922/2017...Current T-Mode template variations
The right hand one may hi-lite the MT Sling pattern better...
(two of them printed between 14:00 and 14:01)

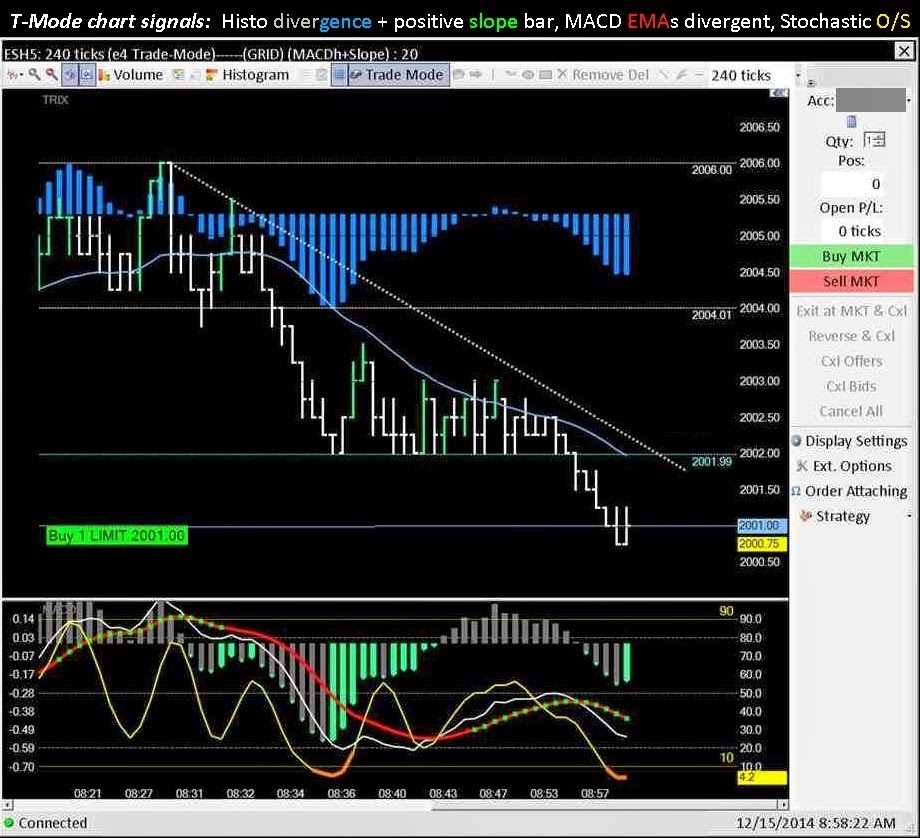
09/20/2017...Revisiting the 1-2 Punch combo
Stochastic TA (5,4,3) Hooks up and then the WMA (4) of the MACD Main EMA turns up
Note the MACD Histo slope is also positive...the MACD Signal EMA is slower
but turns positive just a few bars later...I consider the MACD Signal to indicate TREND

08/30/2017...A Trend Following template set
The study contains a filled MACD histogram (Area not Columns)
4 period WMAs are applied to the MACD EMAs along with Coloring and Show Cases.
White or red candles/bars are 'normal' up/down colors
The lime candlesticks and/or OHLC bars' are colorized via the WmaMac EMA slope.
Stochastic %D is placed in with price for a "Trigger" signal.
Same chart, candlesticks or OHLC

08/22/2017...I love the look of divergences in the morning...


07/30/2017...New Entry chart templates
Experimenting with placing the Stochastic (5,4,3) and WMA (5 period) of
the main MACD EMA (12,9,26) in with price.


07/24/2017... The 1-2 punch REVERSAL set
Signals from the oversold stochastic HOOK combined with the WMA-MAC-EMA turning UP


07/18/2017...Reacting to bottom reversals
First the stochastic hints then the MACD EMAs confirms...


when you see your old friend DIVergence too...

07/05/2017...Brach Zone pull backs
A way to anticipate reversals that may occur...IE: a "guess" for order entry placement.
Sometimes works well, especially if the higher time frames suggest trend reversal clues...
This occurred over a one hour period


Note the Reversal 2B and the add'l entry signals before each of the retraces ...


06/29/2017...P/A + Indicators

P/A + Indicators + Multiple Time Frames

and reviving TRIX + STO in the study.

6/23/2017...DOM, Quotes and T&S
Combined ApexTrader and Medved Trader or w/o Medved

06/21/2017... DIVergent Stochastic Re-Hook


06/19/2017...Reviving the BLINE
Also moving the MACD histogram in with price leaving it's EMAs in the study pane with Stochastic %D.
This allows for a smaller, less busy study pane and also enlarges the price pane.


06/15/2017...Simple?
But I've been seeing various combinations of this stuff for so long that it IS simple to me...
Basically I use trend lines, price action patterns and indicator patterns.
AND multiple time frames help to confirm or clarify the repeating patterns of all the stuff I use.

06/12/2017...The old two step pattern
Two drives down before reversing and going up
30T on left...
Positives -- Potential for a 2B with the STO about to hook up ... ... ... ...
Negatives -- down sloping MACD EMAs and NO histo divergences
45T on right...
Positives -- Potential 2B, STO Hook and is divergent, slight Histo DIV
Negatives -- down sloping MACD EMAs ... ... ... ... ... ... ... ... ...

Below -- another day, another two step pattern set

05/25/2017...Be ready to abandon patterns...
Don't lock yourself into a position.


05/19/2017...MT for trend - STO for when


05/16/2017...Waiting for better signals to Enter
These two sets show why you are better off waiting for better signals.
The 1st set shows an entry with a "marginal" signal -- Stochastic Hook


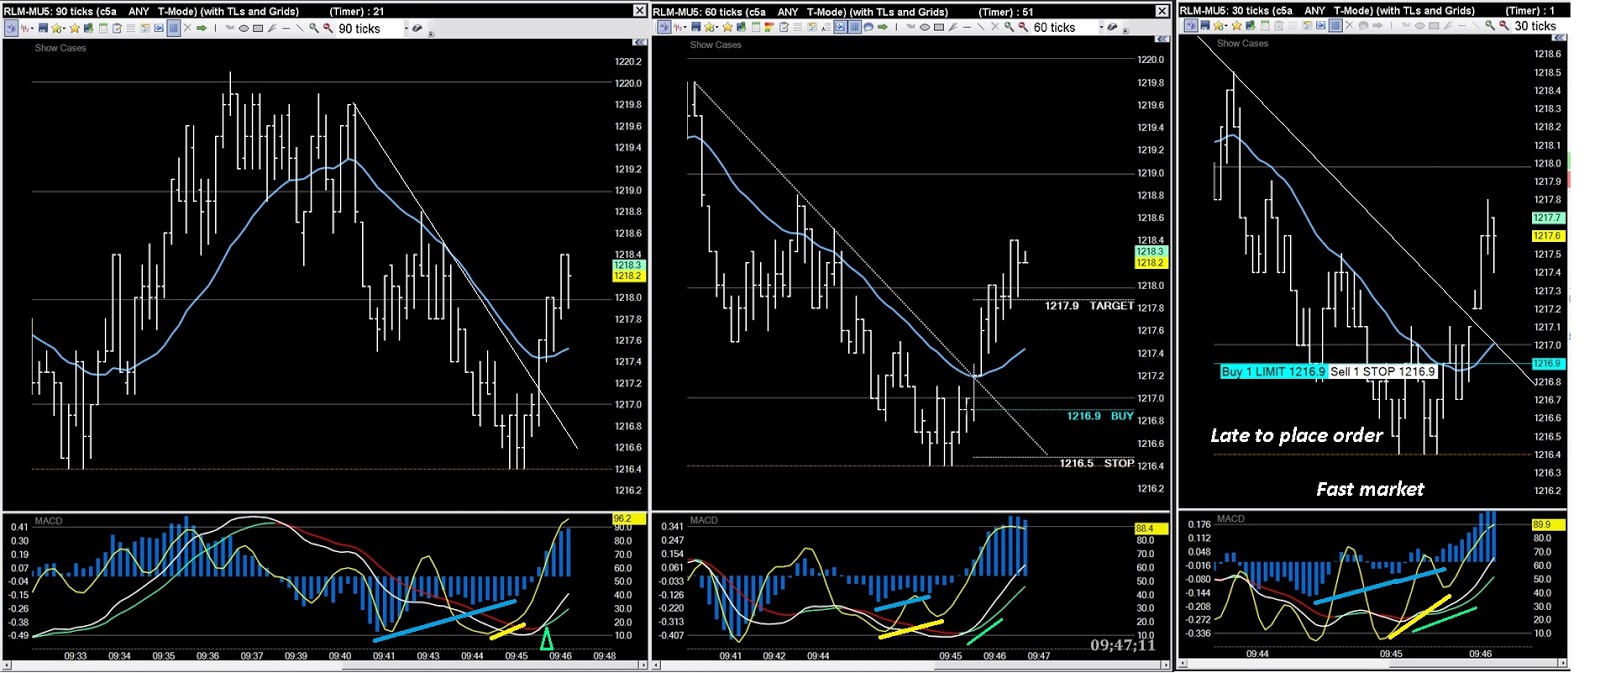
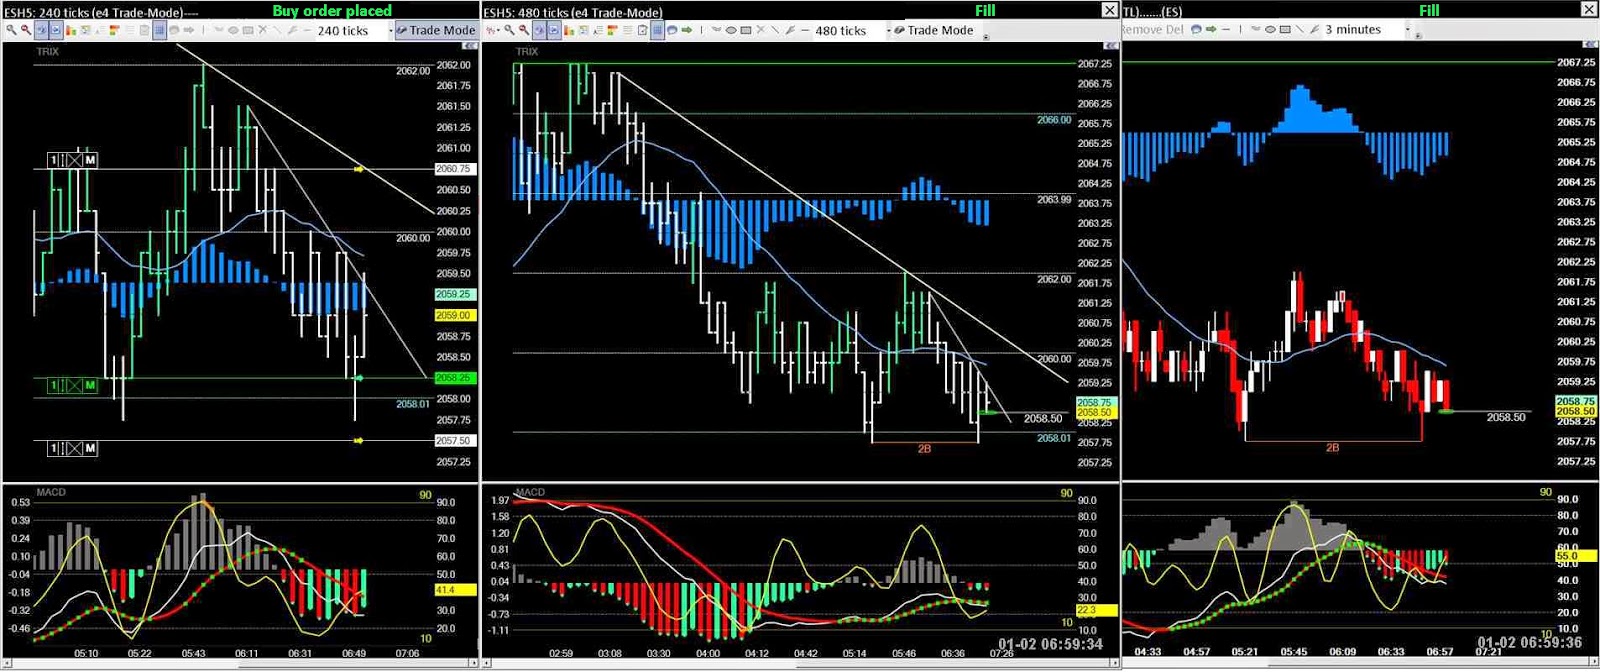
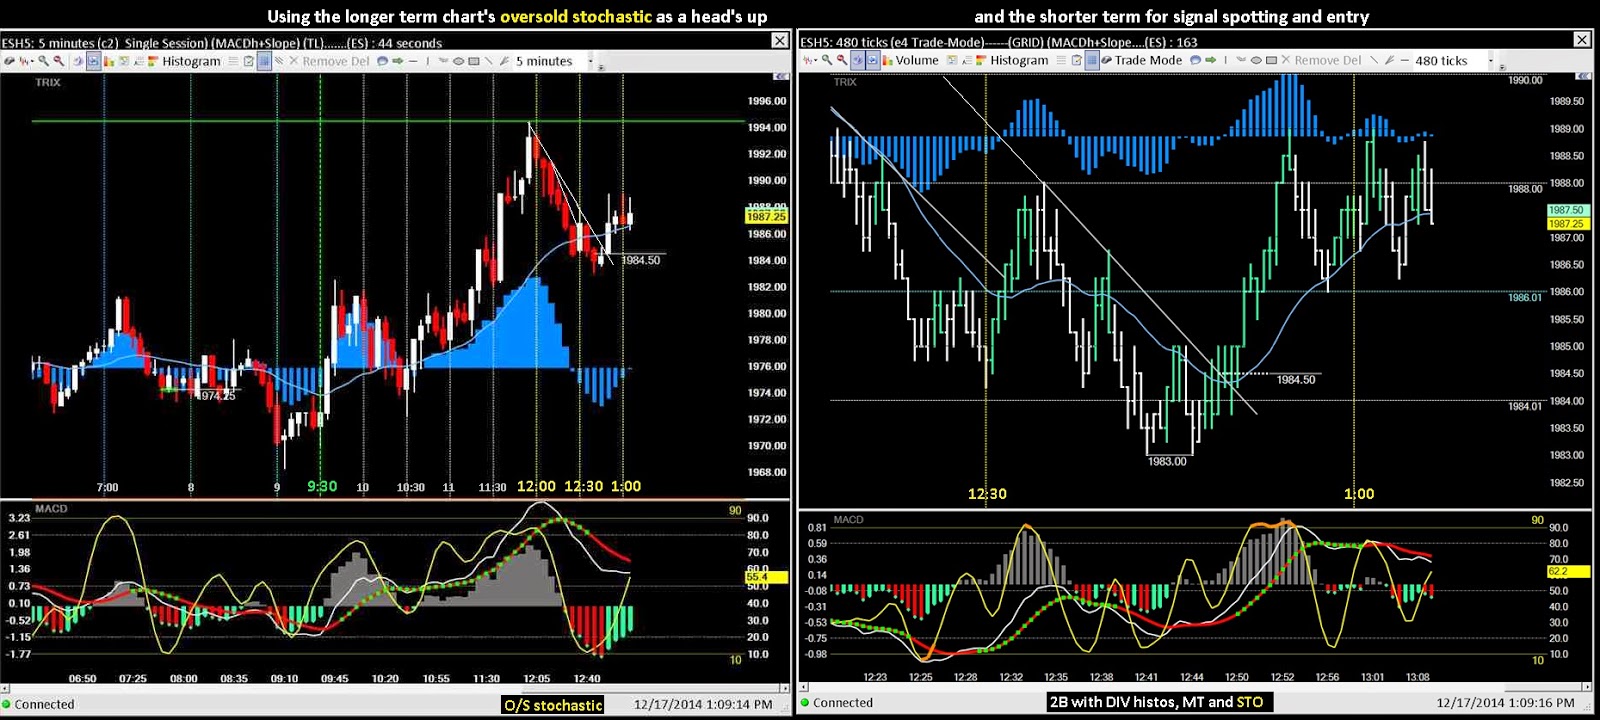
05/09/2017...Using multiple time frames
Very often I use all three for spotting signals for entries...T-Mode entry charts (left 2)
and trade results (right)...also good for documentation and for later review.


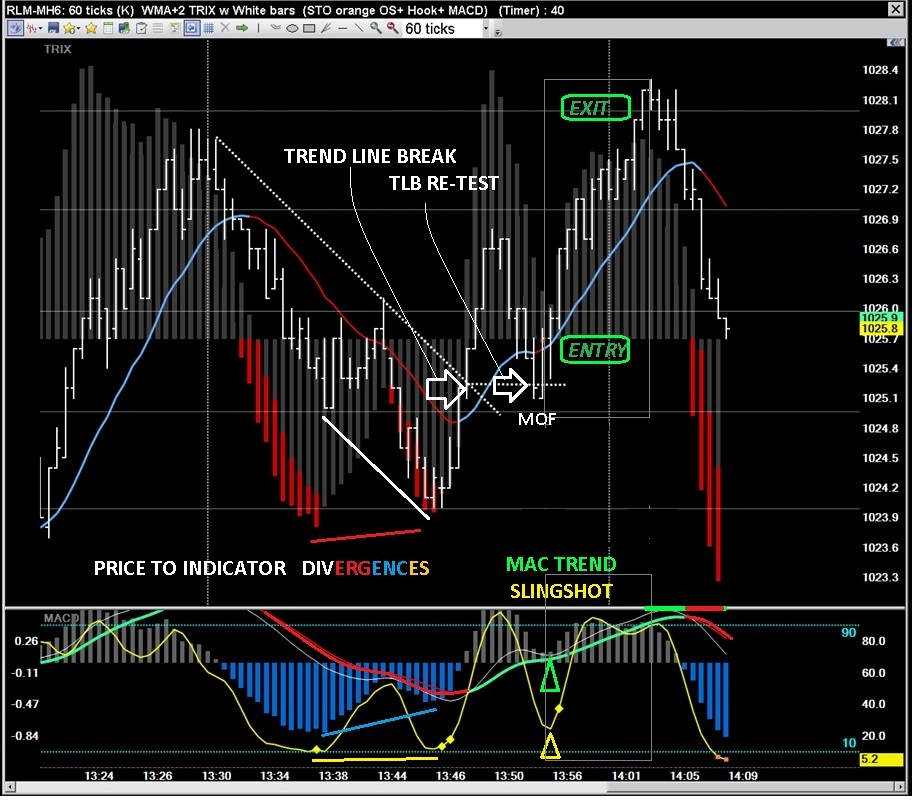
These next charts show what happened after getting stopped out on the trade shown above
(see the horizontal arrow on the right hand chart)
Price went on to form a DIVergent 2B bottom with an MT SLING as the entry signal
(see the vertical arrow)

A downtrend reversed by a divergent 2B, then a Trend line break followed
by a TLB Re-Test (MOF) and then a MAC Trend Slingshot

05/03/2017...5 Wave ascending triangle
... bottoming reversal pattern was pre-announced by the histogram divergences
propelled up by the MAC Trend Slingshots while suggesting
an initial target @20856 (the session open price).

05/02/2017...Time and Tick
Same time period, very different look.

5/01/2017...Breakout then a Flag on a pole
Long term pattern and short term


04/27/2017...Price Bar & Candle color themes
30T+60T 60T+90T Lower monitors

Good signals sometime FAIL to precede good reversals -- using Buy-Stops
can often keep you out when signals fail...tho you gotta cancel them...

04/21/2017...An explanation of the Indicators I use
Most charts have price with a TRIX histogram over a study combining MACD & Stochastic.
I also apply Show Case 'Paintbars' and Coloring tools.

04/20/2017...
The dual MACD histos allow better control of the Signal/EMA lines.
They stay within the study pane now....Also trying out price-line charts

04/07/2017 ... Time on my hands ...
but it's nice to have options for the ol' layout and mix it up here 'n there


4/07/2017 ... Bombs away ! is apparently bullish

4/05/2017... A TIGER!...a f'n tiger
I forgot all about the FED minutes release today.
And here I thought what the FED would say was old news...
Apocalypse NOW!
Remember the cook's rant "Never get out of the boat"... He ended up losing his head.
NEVER forget the FED.

03/27/2017...Trying to set up a bottom


03/23/2017...Trying a new "trigger" for T-Mode charts

03/20/2017...Zeroing in across time frames
Reading a 3 month daily, 2 hr-5 session, 1hr-2 session and the current session


03/18/2017...The Charting Arts
Examples of the things that can be done with great software...

03/16/017...The ol' 2-step...

03/15/2017...Market Pace and Time of day
In general, the markets are most active between 9:30 and 10:00 AM. The pace of market activity
varies greatly throughout any trading session. I've touched on this subject before...
It's explained somewhat more in-depth on Table of Contents page 7.
I contend that price action is price action, no matter when you decide to place your trades.
Pattern relationships between price and indicators remain the same regardless of the time of day.
Market pace determines how much time passes before patterns complete. The in-and-out trade below
would only take about 3 minutes during very active market Times.

03/07/2017...Different TF can make different Signals
Even minor time frame changes can show you stuff...

03/03/2017...Time Frames and Indicator Relationships
You have to really study the minutia to see the subtle differences.

02/20/2017...Different software will print different charts
Comparing the ApexTrader and Medved Trader charting software rendering reveals
subtle differences that are common to all software programs. These two charts are set up very similarly
but it is difficult to get them to match exactly even though they are using the same data feed.
I like the look of the timing curves produced by Apex's Stochastic (TA) but am unable to replicate
the EXACT same shapes and turns by manipulating Medved's fast or slow stochastic indicators.
Another issue I'll have to get used to is the differences between the tick-per-bar settings.
Apex's 40 tick chart is approximately equal to Medved's 13 to 16 tick chart...

02/16/2017...Like shooting ducks in a barrel
Simple as 1-2-3, easy as A-B-C

02/15/2017...Patterns
Perfect pennant on a pole - limit entry at lower trend line (@ 5)
or a buy-stop at upper trend line for the breakout.


02/13/2017...MACD trends

01/25/2017...DIV REVERSAL - With & W/O annotations

01/17/2016...Cluster WAG Entries
Luck can have something to do with it

12/18/2016...Playing with indicators
Differing indicators can be manipulated to show very similar results...
Here I'm comparing a couple of TRIX EMAs with a standard MACD.


12/08/2016...WMA HOOK
This signal is slightly slower to print than the TRIXh Slope (gray histo) and the
TRIXh BLINE (white dots on TRIX histo). The STO (yellow line) hooks up at about the same time
while the TRIX Signal line (fuchsia+aqua) and the MACD Signal line (red+lime)
coloring print just afterwards.

Another example on two time frames


12/02/2016 MAC-Trend and TRIX-Trend
Almost identical turns are high-lighted on the EMAs

11/10/2016...chart set up

11/05/2016...Variations on the BLINE theme...
- - -Trend indicators- - -
The MACD Signal EMA tuning positive and TRIX histogram sloping up.


11/01/2016...Back to the BLINE
I'm still testing the BLINE ...It's based on the TRIX indicator which is set as a histogram.
I've applied the formula to show on the histogram bars and on the price bars.


10/20/2016...Playing with Painted bars
Paint-bar tests - These chart experiments have the normally white price OHLC bars change to
lime when-ever the MACD Signal EMA is sloping up.
They then get colored red when-ever the stochastic %D gets highly over-bought and begins to drop.
I am not using these paint-bar colorings except to get a feel for how they work, perhaps
for finding other possible variations should they seem helpful for reading Price Action.

10/19/2016...Run up...Retreat...Re-enter
Been noticing a lot of these 3Rs of late...roughly 50% retrace for good re-entries.


09/28/2016...Testing a new layout
Overlaying the smaller sized chart over a larger on the same monitor gives a unique perspective.
These snapshots show the set up across my lower three screens.
The arrow placement is approximately at the same spot across the 6 charts.
T-Mode screen - M4


09/22/2016... 4a....BLINE trade Pattern ...
I added a new page explaining how to use it, it's draw backs and it's usefulness.
09/20/2016...The BLINE...6 for 6
Hard to believe you can scalp bits and pieces using signals from a 30 minute chart!
Six consecutive winning BLINE signals with a little help from your friends (stochastic).
(Slightly less than 3 complete sessions)


(Slightly more than a full session)

09/16/2016...Some new Templates
Left - MACD histogram with price, MACD EMAs with Stochastic
Center - MACD histogram with price, TRIX EMAs & histogram with Stochastic
Right - TRIX histogram with price, MACD with Stochastic

Hollow candles with MACDh over STO+TRIXh+TRIX EMAs

Hollow Candles with TRIXh over STO+MACD

Signals on 3 time frames

09/06/2016...Still experimenting with my BLINE indicator
Seems it can be useful on longer term charts.
Very often MT and MAC histo will be negative or not displaying divergences
to be of much use for getting a heads up on potential reversal areas.
BLINE and stochastic signals are quicker to print.
I added the BLINE to my LT 'spotter' charts and removed them from my trade charts.

09/08/2016...+$250 per contract
BLINE signals on a longer term tick chart along with my other
'standard' old reliable signals

This was epecially noticeable on my trade-mode tick charts but happens even on the 1 and 3 minute.

09/03/2016...Wyckoff Power Charting
From StockCharts blogs by Bruce Fraser...his explainations of
Wyckoff's market action are very similar to how I view price Action...


09/01/2016...Back to basics...KISS
Time frames, Divergence and MT SLINGs

The old 2 step to profits...
Step 1) Test the market while watching multiple time frames


Trend Line breaks, Divergence, Mac Trend, Slingshot and multiple Time Frames

8/16/2016...BLINE update
I've shelved my BLINE idea for now...
It's not as reliable a signal generator as it first seemed to be - too many 'false' signals...
08/07/2016 Sunday night..."Slow Motion" markets
...P/A is P/A regardless of when you trade...It pays to trade the pre-market...
It's a good time to try out new trade ideas and/or new strategies.
It may test your patience but you if you can keep your attention sharp it's sort of like
the markets go into "slow-motion"...This one took over a half hour in-and-out...
If this trade was put on during the MMO it would have been over in 4 minutes or less.

08/07/2016...Latest BLINE templates
The indicator is working well on Tick or Time based charts.
Like all indicators you still need to use your judgement when acting on its signals.


08/02/2016...TRIX-TREND-HOOK (BLINE)
Here's another idea for getting some help spotting good SLINGs or STO Hooks
using TRIX Trend in instead of MAC Trend.
It uses an EMA applied to the TRIX 5 period line which is already a combination of EMAs...


08/02/2016...Bline update
Can't get the Bline indicator to work as I had hoped it would work...
the Show Case indicators won't update properly on the stochastic line.
07/31/2016...Bline
Added another 2 templates with much slower stochastic indicators. Testing to see if they
can be helpful for spotting MT SLING patterns or if they are too much added clutter.
Borrowed "Bline" from Buffy of daCharts.com (but not her parameters).


07/26/2016...Hunting for REVERSALS

It may test your patience but you if you can keep your attention sharp it's sort of like
the markets go into "slow-motion"...This one took over a half hour in-and-out...
If this trade was put on during the MMO it would have been over in 4 minutes or less.

08/07/2016...Latest BLINE templates
The indicator is working well on Tick or Time based charts.
Like all indicators you still need to use your judgement when acting on its signals.


08/02/2016...TRIX-TREND-HOOK (BLINE)
Here's another idea for getting some help spotting good SLINGs or STO Hooks
using TRIX Trend in instead of MAC Trend.
It uses an EMA applied to the TRIX 5 period line which is already a combination of EMAs...

Using the BLINE... [TRIX TREND (TT) plus STO HOOK]

Another template with the MACD in with price, the TRIX histos moved into a new study.
I have never liked to use multiple study panes but this template set-up isn't too bad...
Plus the TRIX histos pane can be made to disappear for all intents and purposes.

So far this new indicator is showing terrific promise for timely entries...
It's working across multiple time frames and multiple markets.
It seems to catch price before it explodes up and does not require a large initial stop...

Can't get the Bline indicator to work as I had hoped it would work...
the Show Case indicators won't update properly on the stochastic line.
07/31/2016...Bline
Added another 2 templates with much slower stochastic indicators. Testing to see if they
can be helpful for spotting MT SLING patterns or if they are too much added clutter.
Borrowed "Bline" from Buffy of daCharts.com (but not her parameters).


07/26/2016...Hunting for REVERSALS
Experimenting with having a small 60T and 90T docked in the same window with the 30T T-Mode.
It fits on a single screen and makes entry signal comparisons simple - IE: no need to scan 3 different monitors before placing an order...
Plus it enables a simultaneous "one click capture" snapshot of entry signals across three time frames.
I still display larger charts too - they are needed for drawing trend lines and for the bigger picture they provide...snapshot below shows the chart set up...
(Apart from the 2xD earlier on the 30T, no particularly 'good' signals were showing when I snapped the picture)
(Apart from the 2xD earlier on the 30T, no particularly 'good' signals were showing when I snapped the picture)

07/24/2016...MT SLINGs "Late to the party" continuations
A stand alone Slingshot can be a good signal to enter a position in the early stages of reversals.
A Slingshot that's associated with up sloping or horizontal MACD EMAs is the better trade.

 Another multi time frame look at MT SLINGs


MAC Trend + Slingshot continuation pattern...MT SLING


07/22/2016...MT SLINGs on higher time frames
I'll be tracking this idea...perhaps it'll prove to be a way to cut down on stop-outs when anticipating moves
yet still enable participation in the price explosions provided by good MT SLINGs.

07/20/2016...Reversal vs Consolidation patterns
There's no telling how strong an effect divergence will have on P/A after it forms
so always be looking for confirming signals...
But also be aware that a bigger consolidation pattern can go either way
and can change bullishness into bearishness.
so always be looking for confirming signals...
But also be aware that a bigger consolidation pattern can go either way
and can change bullishness into bearishness.

07/14/2016...More MAC Trend Slingshot ideas
Although it does occur with divergences at bottoms, the MT SLING pattern
is more often a trend continuation trade than a bottom reversal trade.
Slingshots occur very frequently but often form without any other confirming signals...
Relative to the "failure" rates of stand alone Slingshots vs MT Slingshots,
those that form with a horizontal or up-sloping MAC Trend are the better trades to take

Relative to the "failure" rates of stand alone Slingshots vs MT Slingshots,
those that form with a horizontal or up-sloping MAC Trend are the better trades to take

07/13/2016...Lunch time Price Action signals...

07/08/2016...New triangle ID'ed on the daily ...
♪♪ Where to now St. Peter? ♪♪
It's the old triangular consolidation pattern within a larger megaphone pattern...
The triangle is defined by the doji star top on Monday July 4th, followed by a wide range sell-off Tuesday
and a long tailed hammer reversal on Wednesday...
To top it all off, yesterday's wide range doji formed a nice indecisive diamond pattern...
With all those contradictory bullish-bearish clues it's No wonder the over night is up!!!
 The indecision turned bullish - BREAK OUT!!!

The triangle is defined by the doji star top on Monday July 4th, followed by a wide range sell-off Tuesday
and a long tailed hammer reversal on Wednesday...
To top it all off, yesterday's wide range doji formed a nice indecisive diamond pattern...
With all those contradictory bullish-bearish clues it's No wonder the over night is up!!!


07/01/2016...Use multiple TF's to advantage
In this example the 90 tick shows a TLB after a bottom was put in. I thought I had missed the play...
But then price pulled back as the MT trend continued moving up ...the stochastic was falling fast, setting up the potential
for an MT SLING. ..The 45 tick was already very O/S and then developed a HOOK signal for entry...

06/29/2016...P/A Divergences

06/18/2016...TLB and Late-to-the-Party
Back to back trade opportunities happen very frequently.
The 1st one uses a P/A event for the entry, the 2nd uses an indicator Signal for the entry.
The 1st one uses a P/A event for the entry, the 2nd uses an indicator Signal for the entry.


09/19/2016 Sunday night...the HOOK
Just some observations...Time Frames and indicator Signals in the early hours of the new session...

Some more observations...Time Frames and indicator Signals


06/17/2016..Just a WAG for a scalp

You can over-think & miss good trades. Discretionary trading is like that but there's ALWAYs another trade. Bullish
 I require continual reminders - to refrain from taking too many "marginal" entries and to limit over-trading....


.06/13/2016...ApexTrader charting
Here are some of the automatic 'annotations' that can be added via the software.

06/03/2016...What goes down must go back up
Chasing the reasons WHY is silly...
Just accept that markets continually rebound from down-to-up...concentrate on taking money from the moves.


06/02/2016...Feel vs Hard STOPS
A $9 gain vs a $6 loss (after commissions).

06/01/2016 MAC Trend or TRIX Trend
The MACD and TRIX EMAs are very similar in their formula design.
A standard 12/9/26 MACD indicator is in with price... in the study, TRIX indicator lines use 9 and 10 periods...the histogram is a 5 period
A standard 12/9/26 MACD indicator is in with price... in the study, TRIX indicator lines use 9 and 10 periods...the histogram is a 5 period

05/17/2016...Signals (early in the new session)
Here is a trade example using the signals that fired on the longer term chart (75T on the right).
The shorter term (45T - left chart) was indicating conflicting signals at the time of entry...
MAC Trend (MACD EMAs) was strong on both time frames.
MAC Trend (MACD EMAs) was strong on both time frames.

Same session after the MMO...Similar to the trade above only in a different market.


05/12/2016...Lunchtime reversal
Longer term Time based charts can be used just as effectively as
shorter term tick based charts for spotting good opportunities...
15 minute - long lower shadow...3 minute - 3xD at the low and MT SLINGS

04/29/2016...Perspectives for Trading Charts
There's no magic formula for picking combinations of time frames that work best.
 T-Mode On-chart trading does eliminate a number of price bars when it's enabled on a chart.


04/28/2016...Negative MT SLING pattern
I've been seeing this pattern for a long time...I'm not currently using it as a rational to short...
The arrow shows an inverted MT SLING pattern with the MAC EMAs divergent to price.
This one also happened to co-inside with a price double top.

04/22/2016...MOF Reversal pattern
MONEY ON THE FlOOR - a recurring pattern that can be taken advantage of every day.
 MAC TREND SLING - another constantly recurring pattern.
The long term for perspective...note the subtle differences between the indicator positions on the two shorter term bar charts
 Multiple Time Frames
Sometimes they print different signals, sometimes the same and sometimes only one time frame prints signals.


The long term for perspective...note the subtle differences between the indicator positions on the two shorter term bar charts

Sometimes they print different signals, sometimes the same and sometimes only one time frame prints signals.

Anticipate by Visualizing
Reversal trading requires a lot of feel for the trade. A well developed feel can enhance your results.
Below are two charts showing realistic entry placement possibilities that combine Price Action patterns
with indicator signals across two different time frame charts.

Waiting for additional signals to identify potential reversals before order placement improves the odds of a successful trade.
Note on the 35T chart that you would have needed to enter on a down sloping stochastic at E, anticipating a STO hook

04/18/2016...Missed trades
Great signals fired on two time frames...missed an entry by a tick.
You can't catch them all but there will ALWAYs be another trade opportunity.

04/14/2016...Manage your trades

04/13/2016... Judging Targets from Signals
Use Test trades to help determine whether or not to take actual trades .
Realistically mark entry possibilities after good signals fire and measure the ranges that print.
Could money have been taken out?

04/05/2016...MT SLINGSHOTS
What goes down must go up . . .
(by how much is always the conundrum)
MACD Trend SLING - - good for front running reversals
The 10 minute chart on the right is longer term than what I use but the idea is the same.
Look for the stochastic to start hooking up while the MACD EMA lines begin to slope upwards
(both should be nearer the bottom of the study)
The potential for breaking a down trend line and the longer lower candle shadows are
additional clues to add to the signals mix.
In the chart below, all these things can be identified BEFORE the reversal happens.
These can all be seen to the left of the blue vertical line.
 Other signals are working well today too.

additional clues to add to the signals mix.
These can all be seen to the left of the blue vertical line.

Other signals are working well today too.

03/28/2016...Anticipate potential P/A patterns
You won't always be correct about what you think may happen
but this is a good habit to develop for enhancing your feel for the trade.
but this is a good habit to develop for enhancing your feel for the trade.

03/23/2016...Utilize a Buy-Stop Entry Technique
Doing so can weed out some "marginally good" trades that may get stopped out...
Whether your entry rational is based on your
Whether your entry rational is based on your
"FEEL" for a WAG trade or there weren't good signals to begin with or when good singles "FAIL".

03/21/2016...Missed Trades
The opportunities never stop coming...They happen all the time but sometimes you just miss them.

03/15/2016...Read your charts
Utilize the tools that are presented throughout this site...Time frames, Price Action and Signals.

I keep the same charts open all day.


03/08/2016...Avoid Unforced Errors
There are alway going to be better trades presented.

03/04/2016...Trade what you see
Often you can spot a pattern on a higher time frame chart that can be used as a heads-up
for a good trade opportunity. On the left, the 4 minute chart had formed a pennant on a pole.
Place your order entry using the signals that may be firing on the lower time frame trade chart.
The two right hand charts document the possible results.
for a good trade opportunity. On the left, the 4 minute chart had formed a pennant on a pole.
Place your order entry using the signals that may be firing on the lower time frame trade chart.
The two right hand charts document the possible results.

03/01/2016... MT or MAC Trend
Otherwise known as the MACD EMA direction, it lags price action markedly when compared to the faster reactions
of the TRIX and MACD histograms. Even so it can be a good entry signal and it helps you stay in a position once taken.
This set of charts documents a reversal early in the new session. Price Action is P/A no matter what time it is.

02/23/2016...ENTRY SIGNAL hierarchy
Some signals consistently work better than others.

TODAY IS A 2B-DAY
 OR IS IT A HOOKER'S PAYDAY?


EVERYDAY IS PAYDAY...
Whether it's Divergence, MT Slings, 2B's or all of them combined,


The session ended on a BZ 2B reversal near the END OF DAY
(although it faded into the close)

EVERYDAY IS PAYDAY...
Whether it's Divergence, MT Slings, 2B's or all of them combined,

02/22/2016...1 Gain pays for 2 Stops
In the long term, discretionary trading is all about the numbers...What's your total trading Win/Loss ratio? Whats your average Ticks Won vs Ticks Lost per trade? etc, etc, etc
Ignoring your statistics will lead you to ruin.

02/21/2016...Nice longer term 2B
Shaping up as a perfect 2B Dragon...A measured move would put it above the BZ area...

02/18/2016...Waiting can Pay
Take the few moments it takes to scan your other charts before acting on impulse...
 In the scenario above, it made only a minor 1 tick difference to the eventual entry level...
Had I not changed my order, my lower bracket would have been triggered - stopped before it popped.
Often the higher time frames will cause you re-think a trade...for much better results.
In this case, instead of a $26 loss I made an $84 gain (after commissions)

The EMA lines are considered 'trend' following indicators...the histograms can be used as signal generating oscillators
Having the histos in with price makes divergences very apparent. Sometimes the MAC gives better signals, sometimes the TRIX.

02/12/2016...Keep it Simple
Post major market


Pre major market

02/10/2016...2B Dragons
I really like the pattern for calling reversals.Used for long term or short term Price Action projections...

02/01/2016...P/A and Indicator Signals
These patterns happen every day - on all time frames and in any market.

01/30/2016...Muliple market MAC TREND Signals

01/28/2016...You must be IN to WIN
You never can be certain which trades will win big.

Perfect signals happen : 3xD below the TL, MT Slingshots that also show the MOFs.


01/27/2016...Multi TF continuation of trend

01/25/2016...Price Action PACE
Major differences exist between TIME based and TICK based charts...
Differences can be especially noticeable when market activity or PACE increases :
Price bars often lengthen on TIME based charts as activity increases...but not always!
Time based charts may not reflect rising activity levels...
The rate that new bars print and the number of bars that print always increase
with TICK based charts whenever PACE rises.

01/22/2016...What I try to achieve...
The example below shows a trade possibility that really did not have great signals firing.
There was the possibility of an MT SLING to propel price upwards. The center chart is how my T-Mode charts
are displayed on the layout. All the yellow and lime text annotations were added afterwards using MS Paint.
are displayed on the layout. All the yellow and lime text annotations were added afterwards using MS Paint.

01/18/2016...Bits and Pieces at a time
Scalping : take Bits and Pieces at a time from the market applies to profit taking
BUT
it also comes into play for limiting the damage done to the bottom line from the inevitable STOP losses.

01/10/2016...3XD Dip-and-Rip
THREE INDICATOR DIVERGENCE...
These charts were 'snapped' on different days, taken at different times of the day and are of different markets.
3XD shows up using either TIME or TICK based charts. They illustrate the power of 3XD reversals on very short term and longer term charts...
On the left is a 60 tick-per-bar per bar chart of the YM ... a 300 tick-per-candle chart of the RUT is on the right.
Similar three indicator divergence signals show at the lows on both charts. The RUT printed an MT SLING after breaking the trend line.
I'm naming the entire pattern on the right hand chart a Dip-and-RIP Runner because of the extended move afterwards.

01/07/2016...TIME vs TICK based charts
The two charts below cover the same session for the RUT E-mini. Although their price action shapes are similar
there are many obvious and subtle differences to be aware of between time based and tick based charting.

12/31/2015...Reminder:

12/29/2015...WMA-MACD as a Signal
I use two Weighted Moving Averages on most of my chart templates. One is a 30 period WMA that prints in the price pane.
The other is 4 period WMA in the study pane (the white line) which is applied to the faster MACD EMA ...
The red and lime line is the standard Signal MACD EMA.
The 4 point white star prints whenever the faster WMA-MACD EMA turns from down to up.
The other is 4 period WMA in the study pane (the white line) which is applied to the faster MACD EMA ...
The red and lime line is the standard Signal MACD EMA.
The 4 point white star prints whenever the faster WMA-MACD EMA turns from down to up.

12/21/2015...P/A, Signals and Time Frames

12/18/2015...Picture Perfect Pattern
2B Dragon Price Action Pattern with three indicator divergence Signals

12/14/2015...4 chart sets covering 2 hours
What goes down must go up...and vis-a-versa of course


12/08/2015...nice day in the RUT
The DIV MT SLING


12/04/2015...Time Frames and Signals
First comes the divergence signals suggesting a potential for a trend change...take an initial entry

Continue to watch for signals that confirm the establishment of the new trend...
Add to initial position or initiate an entry if you missed the divergences

12/03/2015...There will be days like this...
When you are afraid to trade - don't - just get over it ASAP because the 'Coulda-Shoulda-Woulda's
can easily put you into a funk-slump...Remind yourself that there will always be another good trade to take.
This one Coulda-Shoulda-Woulda returned $700
This one Coulda-Shoulda-Woulda returned $700

...Standard Operating Procedure...
******12/01/2015*******
The market vehicle you choose to trade does not matter -- Repetition of method does

******11/26/2015*******
Watch multiple Time frames for Signal Divergences before Price breaks out above the Trend Line.
These patterns and signals occur in ALL markets and on ALL time frames ...ALL THE TIME.


11/24/2015...Time vs Tick charts
Viewing both can be useful for making entry decisions...

11/23/2015...Divergence, Signals and Time Frames

11/21/2015...Late to the Party trades...
The center narrower study pane showcases what I call MAC Trend Turns. The faster MACD EMA printsa white diamond and the Signal MACD EMA prints a smaller lime triangle when either begins to turn up...
They ARE NOT used for early initial entries - they lag too far behind faster reacting oscillators (STO & Histo).
I use them mainly to add to a well filled early entry position. But they can also be used when a good
initial entry point was 'missed'. They help with the decision whether to enter a late to the party order.

Relationships between P/A and signals are almost always different between chart time frames
but often there will be a 'heads up' on one that can alert you to look at the others for entry opportunities.
11/19/2015...QuoteTracker fans...
Those of you who are familiar with QT will be glad to know the Medveds are developing a replacement.
Medved Trader (MT) beta is available NOW for free. It already supports a variety of brokers
as well as independent vender's data feeds.
It is a beautiful program and incorporates much of what you'll recognize from QT.
You can expect the same level of features, support and dedication that Jerry and Mike always provided.
I have been trying it out using Yahoo Finance's free data feed...Track stocks, ETFs and Indices
(including back fill) - Daily & intraday...For futures, Yahoo provides the Continuous Contract symbols...
I'm still getting to know where everything is in MT and am enjoying many of the new features...


11/19/2015...Better Entries
Price Action, Time Frames and Signals


11/17/2015...MACD and Stochastic
Ever wonder why so many traders use these two indicators?
Because they work.

For short term scalping I like Tick based. They show much more at a glance...and earlier
(another new template, separate study pane for some of the Show Case indicators)

I still need to do some 'tweaking', changing when the MACD EMA directional Show Cases print in the study...
Like most indicators they tend to print a bit late - less so as you move toward shorter time frames.
IMO, the MACD is a terrific tool - a combination of an oscillator (the histogram) and a trend follower (the EMAs)...
I use the standard MACD settings (12,9,26) and have not been able to improve upon them by substituting
with different length periods. I also use a relatively fast stochastic (5,4,3 sma) displaying only the Slow D line.

11/16/2015...AH trading is very SLOW
The same methods and signals can be used as those used during the major market hours.
Market action is pretty much the same, but it usually takes a lot more time per trade.

11/12/2015...Trade Management is KEY
Sometimes even with good signals you loose. Three of four trades got stopped-out...
Managing the losses helps to eliminate REALLY BAD days.
On the other hand, just using a wider stop on the first entry would have resulted in a nice gain...
BUT you never can tell when a massive drop will take you with it...I hate when that happens.

11/12/2015... Remember the Classic Patterns

11/11/2015...Keep it Simple

11/09/2015...Price Action - patterns and signals

11/06/2015... Anticipating a reversal (at some point)
When you see potential reversal patterns or well defined signals on the longer term
"'Spotter" charts, the following methodology often saves you from getting some FILLs-and-STOPs...
Using Trailing Buy-Stop orders can keep you out if you misjudge the strength if the current down trend.

11/05/2015...The MT SLING pattern set up
On a very short term 22 tick chart shortly after the majors opened...

And a 2B MT SLING pattern set up on minute based charts near noon time...

11/04/2015...Why I don't short...
My methodologies work best for taking longs.

▲...It took over a half hour to move up and only 12 minutes to erase that effort...▲
10/30/2015...The never ending repetition of signals and patterns

10/30/2015 - More TEST trades over a 30 minute period
What was learned -- wait for confirming signals


10/29/2015...Test trades can help get your "FEEL" up to speed
Here's four examples from the pre-major market hours...they are back-to-back, spanning 40 minutes...
The left hand charts show the order entry, the right hand show the results.
What was learned -- decent signals and patterns were working but they did not produce great runs.


10/28/2015...FED minutes today...

Take out bits and pieces at a time


Price Oscillations are ALWAYS happening

10/21/2015...Buy-Stop entry technique
Signals were OK but the market just wasn't ready to oblige.

10/19/2015...ya hast to take some chances...
Better to do so when it can't hurt you too much.

10/13/2015...MT aka MACD ema crossovers
In general, they are VERY reliable reversal signals on any time frame

10/10/2015...New MT templates...
Generally I find that having too many indicators on my charts usually obscures the price action.
But here's a couple of possibilities I'm going to try just for grins...I added the same MACD stuff to the price pane that were
already present in the study. I'll try them out on differing time frames and may end up running just the MT diamonds.


10/08/2015..."Late" to enter MT signals
Waiting for a reversal to consolidate very often offers good entry opportunities


Combining differing time frames can get you in early - add to your position at the "Late" signals

There are times when the longer term 'Spotter' chart doesn't tell you very much -
so all that you use is the trade chart for entry rationalizations.

10/07/2015...Knowing when to stand aside
Good price action can and does fail to produce reversals of substance...knowing when
they are failing is very difficult to determine at times....that's what stops are for...


10/06/2015...Time based vs Tick charting


10/02/2015...Simple but elegant


9/29/2015...Resurrecting the CCL bar coloring
Have previously used 3 Consecutive Closing Lows as an entry signal on T-Mode charts...
Now I'm trying out CCL on longer term "Spotter" charts.
Will see how well they work as a heads up...i.e. to start looking for entry signals on the T-Mode charts...

For the Red Neg Price candlesticks the condition formula used is open>close (includes the candle body)
The 3rd CCL formula is close<close[1]&close[1]<close[2]&close[2]<close[3] (Lime outline and shadows)
For the instances where a 4th, 5th or more CCL candlestick print, the following formula was added:
close<close[1]&close[1]<close[2]&close[2]<close[3]&close[3]<close[4] (white outline and shadows)
10/1/2015...CCL on the "Spotter" chart + signals on the T-Mode

9/29/2015...Remain Actively Involved
Be aware when price is taking too long to move in the direction you had anticipated...
...even when good signals continue to print...


Below is the same trade as the above but a few minutes later...a coulda-shoulda-woulda look...
Tight stops when scalping are necessary but you also must weather the ones that get away...
Just continue to remember : There will always be another trade.

Sometimes the 'better' entry patterns and signals will be present on the Shorter term...

Sometimes the 'better' entry patterns and signals will be present on the Longer term...


9/23/2015...Simple signals
Here's an example using a standard out-of-the-box MACD indicator for scalping bits and pieces on a 3 minute chart...


Another multiple time frame opportunity - entry chart on right

9/17/2015...Same-'ol-same-'ol patterns and signals

09/15/2015...Some more rules to keep in mind
Don't-be-greedy - most trades won't run very much


The next example may get you thinking you aught to loosen up your stops to take larger gains...
That is a type of Coulda-Shoulda-Woulda mind game to be avoided. On the other hand...
If you have already racked up some nice trades for the day
then letting your winners run can be a reasonable tactic.

9/14/2015... Short term signal rational
I 'normally' concentrate on longer term chart patterns and signals for spotting potential
reversal areas and then look to the shorter term charts for confirming rational for entries...
And although I always have several longer term minute based charts open, in this case the very short term
45 tick T-Mode chart was used by itself for making the decision to buy...

9/14/2015...Chart preferences
You can adjust time based and tick based charts to reflect the same price action...
Be aware that the indicators will show only similar partterns between the two types.


09/11/2015...Keep it simple

09/09/2015...It can be frustrating at times
But remember there will always be another trade

09/08/2015...Some of the charts I use:


09/04/2015...Price Action across markets

08/28/2015...Signals across time frames
Three indicator divergence signals (3xD)...below the trend line...on multiple time frames...for low risk entries

08/27/2015...Minimal Distractions
Testing this template as my T-Mode chart set up. Removed non-essentials such as Bid/Ask flags and Time/Price scales
in order to better focus on Price Action to Indicator relationships.

Here is an example of the new template in action...although I missed this trade you can see how it works...
Below shows the T-Mode charts I use for the YM, NQ and RUT...For the ES I use 480 tick, 240 tick and 120 tick chart settings.

08/25/2015...Missed then filled
Keep watching even if you miss getting a fill - opportunities often come back-to-back...

08/18/2015 - Fast markets
Very difficult to get orders in at the level you'd like near the major market open.
08/17/2015 - Time frames and chart width
I am continually making adjustments in order to see what I need to see.

08/04/2015...Money on the floor

07/28/2015...2B Dragon bottom


07/27/2015...Money on the Floor
Combined with good signals, MOF's are very high percentage trades.
Note that the same signals often print simultaneously on different markets.

Other caveats:
Every Price Action Reversal is not necessarily preceded by good signals...
Good signals do not automatically 'guarantee' a reversal is forth coming...

07/26/2015...Tick vs Time based charts
I watch both types but like tick charts for P/A patterns...

07/21/2015...Spotter chart - Reversals Rule
One the advantages of watching multiple time frame charts is the increased number of signals produced...
Some days a discretionary trader will key on the longer term charts looking for divergences or oversold conditions
and then look at the shorter term charts for additional entry rationalizations.
In the charts below, a long tail printed and STO was O/S on the 3 minute chart...Without the 3 min signals
the mediocre signals on the shorter term charts may not have been good enough to take for an entry...

07/17/2015...Combine different stuff - increase the odds
Own the tools that are presented throughout this blog for choosing when to go for it...

07/10/2015...Remember to keep it simple
...Patterns that Constantly Repeat...

07/07/2015...Bottom patterns


07/02/2015...Same 'ol same 'ol
Use the stuff presented on this blog...day in, day out


7/01/2015...Spotting opportunities

06/26/2015...Missed opportunities
Don't sweat missed entries
There will always be another trade opportunity.

06/19/2015...Signals and Time Frames

06/07/2015...Testing TIME based charts
30 second...1 minute...3 minute


06/05/2015...Keep your winners by using Stops

06/02/2015...Don't sweat missed entries
There will always be another trade opportunity.
There are times that you do not or cannot see good signals in order to take an entry and sometimes you are late to react to signals.
Or you may decide to enter your order below the current price in an attempt to get a better fill on a retest...
 Always bear in mind that there are many different signals
 Sometimes you notice it's a BZ day...

5/29/2015...Get into training; to see Signals
Study Price Action; learn patterns and signals...train until they become second nature to you.

05/19/2015...STO pattern
 It only takes a few bars sometimes...

 05/22/2015.... Many more STO trade charts/examples are posted on this iHub message board ...
05/29/2015...Perfect 3xD
 Different day, different symbol, same signals...equally good results.
.jpg)

5/05/2015...Signals and Time Frames
Often the higher time frame will give the better signals.

5/03/2015...The MAC d
30 second...1 minute...3 minute

The pre-major market hours can be slow...

06/05/2015...Keep your winners by using Stops

06/02/2015...Don't sweat missed entries
There will always be another trade opportunity.
There are times that you do not or cannot see good signals in order to take an entry and sometimes you are late to react to signals.
Or you may decide to enter your order below the current price in an attempt to get a better fill on a retest...


5/29/2015...Get into training; to see Signals
Study Price Action; learn patterns and signals...train until they become second nature to you.

05/19/2015...STO pattern


05/29/2015...Perfect 3xD

.jpg)
Different day, different symbol, different signals...equally good results.

Often the higher time frame will give the better signals.

5/03/2015...The MAC d
Hard to beat the standard MAC D ... as a trading tool.
Its considered to be a indicator of price trend (esp. it's EMAs) but when combined with
it's histograms it can be an oscillator, IMO...the histo is particularly good for identifying divergences:

The Acceleration/Deceleration Oscillator is also pretty good when shown as a histogram:
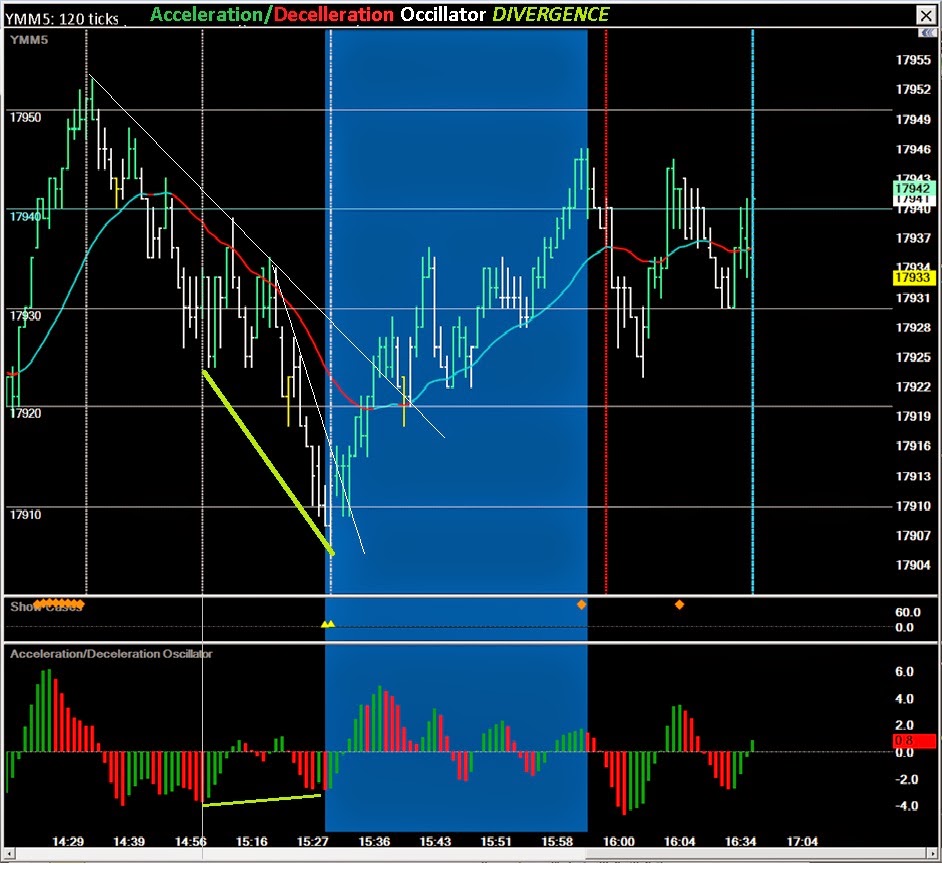
Here a comparison of several popular oscillators (shown as histograms instead of lines) against the same price action....

5/01/2015...CCL setting up the FLO
Combining two trading patterns
Three Consecutive Closing Lows (CCL) and the 1st Monday of the month (FLO)
The NQ is printing CCL's as we approach the ES entry for May's 1st Monday...
My idea is to take the ES trade at the session open Sunday night...IF the NQ does indeed reverse...
IF the NQ does fill at Thursday's closing price, I'll assume that its leading again and anticipate the ES following that lead...

04/30/2015...Can't play them all

04/21/2015...Always keep the basics in mind

Simple...works


This pattern repeats continually

04/16/2015...Time Frames, Signals and patterns
Divergent reversal followed by a 'perfect' measured move

04/14/2015...TREND INDICATOR - MT or MACD EMAs

4/02/2015...Multiple Time Frames & Signals
Simple to see but difficult to discipline yourself to wait for it to happen...


3/27/2015... Putting all together
Combine many aspects of the techniques described throughout this blog to enhance your trade results...
Use Price Action, Trend Lines, Indicator Signals and Multiple Time Frames to trade Patterns that continually repeat.


03/27/2014...Failed Reversal Signals
They usually let you know almost immediately...
 03/25/2015...'Fair' or 'good' signals don't always precede winning trades.

03/18/2015 Tails as Tells

03/13/2015 ... Perspective
Use Price Action, Trend Lines, Indicator Signals and Multiple Time Frames to trade Patterns that continually repeat.
03/27/2014...Failed Reversal Signals
They usually let you know almost immediately...
03/18/2015 Tails as Tells
03/13/2015 ... Perspective
Increase your odds for successful trades using multiple time frames

Hammers can be great signals...


Watching the longer term 'spotter' chart for bullish set ups increases the odds
when entering on shorter term signals and patterns.

Oversold Stochastic can be a stand-alone signal for pulling the trigger

Hammering out a low...
Hammers are reversal candlesticks. They print frequently and offer well defined entry and stop levels.
Combining them with other signals can help you decide whether or not to pull the trigger.

Reversed the TRIXh and MACD positions on the chart and combined other attributes

02/24/2015 ... 3 Consecutive Closing Lows
More examples of the method working on lower time frames...I refined the chart template to show just the 3rd CCL bar.


01/25/2015 ... 3 Consecutive Closing Lows Template
So far it seems to work fairly well to identify multiple consecutive lower closes.


the 4th, 5th (etc) CCL shapes from appearing after the 3rd CCL bar.
(note - the yellow arrows and lines were added using MS Paint)

01/27/2015 -- CCL using Colorizing only, OHLC or HLC bars vs Candlesticks...
The 3rd CCL was colored RED and made thicker.
When using HLC bars, Positive and Negative bars are WHITE except for the Thicker, RED 3rd CCL bar...
The 4th CCL, 5th CCL etc. bars will be RED but will be a 'normal' thickness.
With Candlestick charts, the outlines are white...Positive candles are filled lime, Negative candles are filled BLACK to appear hollow.
The thicker 3rd CCL bar is outlined and filled with RED while 4th,5th etc. CCL bars are 'normal thickness.
They get outlined in red and are filled with BLACK...
I also have a similar template that will color the CCL bars that follow the 3rd CCL bar WHITE.
But when switching it to candlesticks it fills those bodies WHITE, making the chart a bit too confusing
because you have to remember that red, black and white bodied sticks ALL mean negative sticks...

01/19/2015 ... Trial Template update
Added an add'l indicator to the stochastic
Simple two chart counter trend scalping

The Spotter chart's stochastic is oversold and the Entry chart showed divergences...
(in the MACD histogram, the MACD EMAs, the TRIX histogram and the stochastic)
These are all signals suggesting a trend change was about to happen...BUY !
10:14 - Enter a market order any where below the trend line or a buy-stop placed at 1982
(stop order would be placed above the current price bar, where price would break above the trend line)
10:16 - A new higher high printed before retracing back to the trend line break-out area
10:17 - The first higher low printed and formed a Money-on-the-Floor pattern which also set up the stochastic's
Continuation Slingshot pattern...All of these signals confirm that the new up trend has indeed begun.
Continuation Slingshot pattern...All of these signals confirm that the new up trend has indeed begun.
This is a good place to add contracts to the existing position...
A few more examples of the method...
The use of trailing buy stops can keep you out of a position when your rationale for entering a position
becomes moot...thus saving you from having to rely on your sell stop to limit a loss.

01/12/2015 ... Trial Template update
I changed the MACD settings on all g and h series templates:
Applied a 4 period Weighted Moving Average to the 'fast' MACD ema to smooth it out a bit - the 'signal' ema
is still at the standard setting...Am still getting used to the new templates but like them so far...
is still at the standard setting...Am still getting used to the new templates but like them so far...

The ApexTrader software is great for customizing charts and trying new ideas.
I moved the MACD, MACDh and lime MT dots to the price pane and eliminated the WMA...
I moved the MACD, MACDh and lime MT dots to the price pane and eliminated the WMA...
A slightly faster TRIX (4) with lime slope coloring is in with the Stochastic.
The idea was to see the MACD EMA cross-overs and their trend clearer. The MACDh multiplier
was cut down from 2 to 1 and given fatter negative bars so that it's slope
was cut down from 2 to 1 and given fatter negative bars so that it's slope
could still be seen when the price bars are over it.
Hopefully the indicator will stay centered in the price pane so I won't have to constantly adjust its position.
The stochastic still has the fatter orange coloring when it's heavily oversold or overbought.
Will see if these templates turn out to make the charts too 'busy' ... (I may try adding 2 differing TRIX EMA lines too)...
At this first application I can clearly see the price action's double bottom AND
the divergences in the MACD, the MACDh, the STO and the TRIXh ...( 4xD ?)

T-Mode charts on monitor 6 - added horizontal grid lines on the shorter time frame and a horizontal 'Last' line.
Made some other minor changes and saved a 2nd g1 template...usually displayed as shown on the RH chart set.
The longer time frame chart has 'On Top' selected to cover the T-Mode column of the shorter TF.


Made some other minor changes and saved a 2nd g1 template...usually displayed as shown on the RH chart set.
The longer time frame chart has 'On Top' selected to cover the T-Mode column of the shorter TF.
Also saved a session chart template for candlesticks...

01/06/2014...3 consecutive down bars
A method for going long suggested today by surfcat on iHub's board...
Buy at the closing price of 2nd consecutive down bar once the 3rd consecutive down bar closes.
One reason it appeals to me is that it can keep you out
Buy at the closing price of 2nd consecutive down bar once the 3rd consecutive down bar closes.
One reason it appeals to me is that it can keep you out
if price does not react in the way you anticipate...saving you a stop-loss to protect from further downside.

Here's the method applied using the longer term chart's signals to confirm an entry on the shorter...
(Note on the 480 tick chart how the entry for the 3 consecutive lows (that became 4) would not have been filled...)
(Note on the 480 tick chart how the entry for the 3 consecutive lows (that became 4) would not have been filled...)

Divergences announced these reversals in the ES and NQ...The ES printed a perfect 2B Dragon bottom as well

Same pattern but without divergences in the YM and RUT...they were very close to doing so too...
( by my definition , prices must make an equal or a lower low while the indicators do the opposite to be divergence)

Pretty basic stuff here, lest we forget...

The 2B pattern...they work with surprising frequency......a scalp example before
and after

It developed into a "perfect" 2B Dragon pattern

...with surprising frequency...later in the day this one printed:


12/31/2014...Signals
Holiday week, early morning on the 3 minute chart...it took nearly an hour to develop but it shows that
good signals work regardless of the time of session and the time frame used.

12/27/2014...2 vs 1 study
The same charts but slightly differing views of the divergent 2B

12/22/2014...What's for lunch?
Tuesday's special is 3-minute RUT...Divergence served on a triple bottom platter

12/17/2014...Chart watching
MACD and Stochastic...the most commonly used indicators. They have been around forever because they work so well.
I use a standard MACD (12,9,26) for its trending attributes along with its histogram, which I consider to be a timing oscillator.
The stochastic is also an oscillator. I display just the SlowD (5,4,3 Sma). The slowK color is set to transparent...
The TRIX histogram in the price pane works very similarly to (and confirms) the MACD histogram.
Time frames and signals for entry...


12/17/2014...Feel


12/15/2014...Pre-major market open scalps
I like to enter trades when the longer term chart's stochastic is deep in oversold territory
and the shorter term T-Mode charts are firing off good signals.

In and out in 2 minutes...Sold a bit too early but am satisfied with the return.
Entry chart - after the stochastic entered O/S on the 5 minute chart above...
 Exit chart - a quick $100 per contract scalp before the majors opened...


Another pre-major market open scalp - 12/16/2014
In-and-out in 2 1/2 minutes...exit with 30 seconds to spare

In-and-out in 2 1/2 minutes...exit with 30 seconds to spare

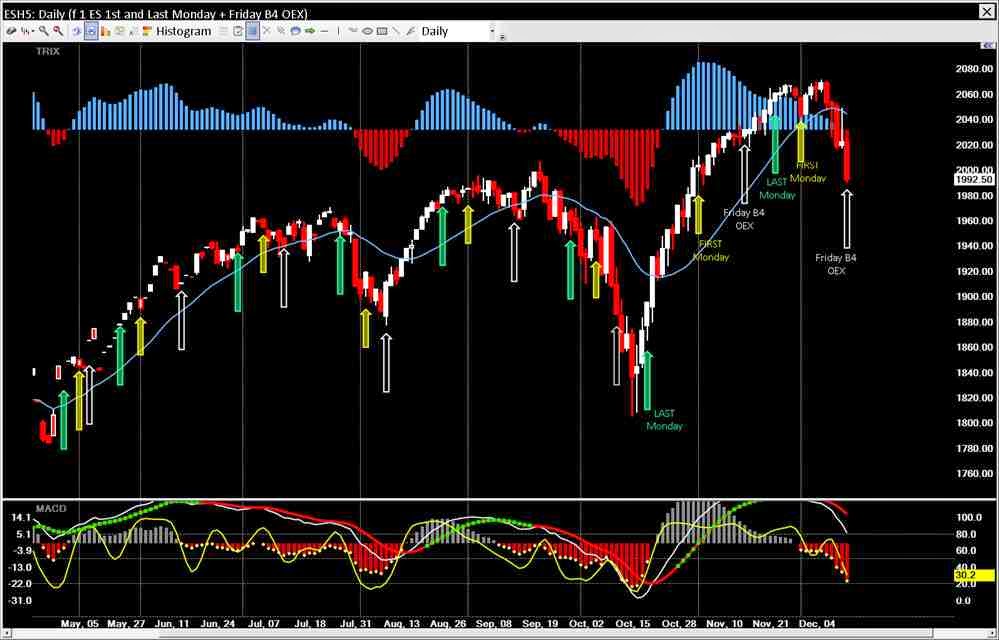
12/12/2014...The Friday before OEX...Corrections:
Had to correct some of the arrows/dates - most noticeably the October turns...
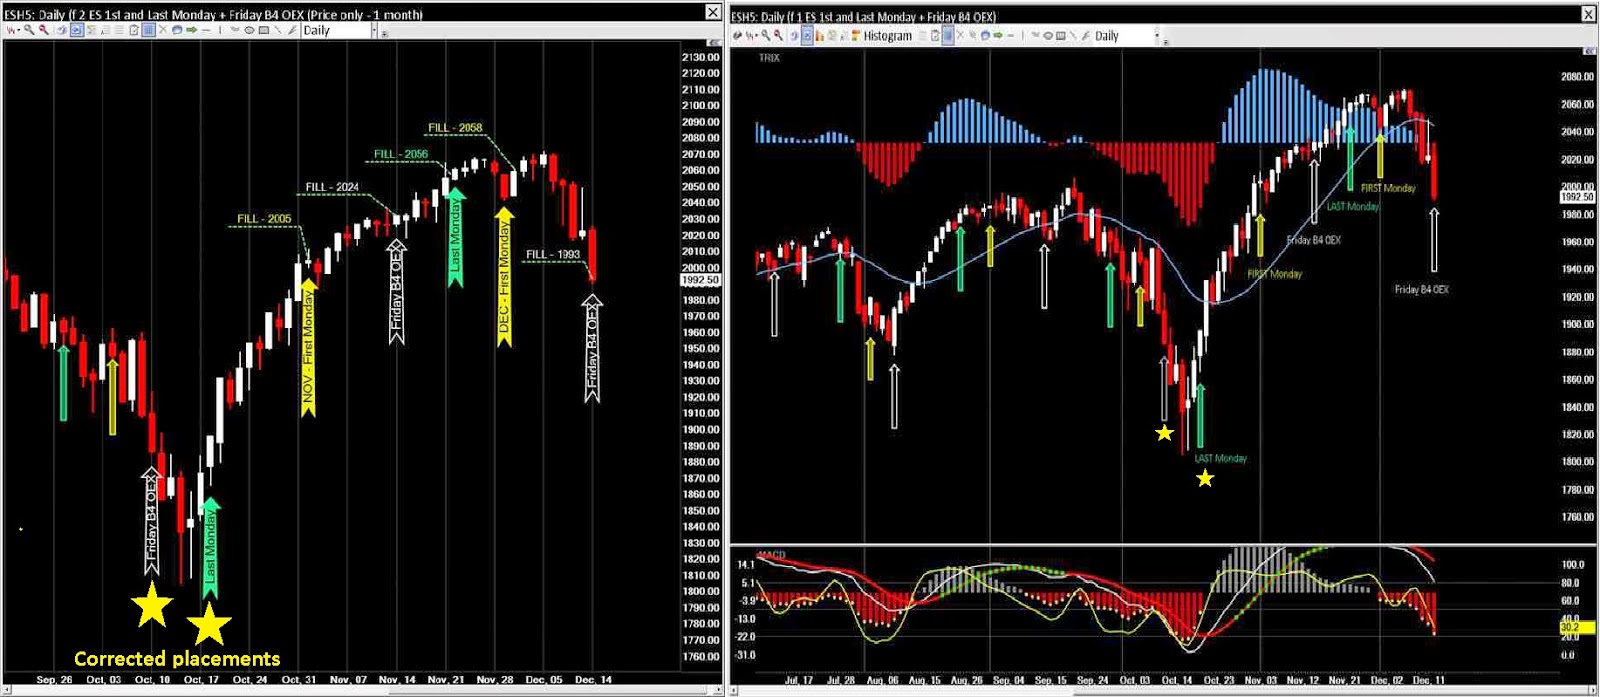
12/07/2014...1st and Last Mondays plus the Friday before OEX
An interesting strategy based on Larry William's work on seasonality and repeating situations.
The idea is to go long the S&P futures on the first and last Mondays of the month as well taking longs on Fridays before OEX.
Monday entries - add 10% of the previous Friday's range to the open price
Friday entries - buy just before the close
Larry's work suggests these have proven to be particularly good entry times for longs, historically.

12/14/2014 - Corrected the arrow placements for October...
12/04/2014...The pre-market
Interesting movement before the majors opened...
Shorter term patterns and signals are easier to see and happen with more frequency...
Allowing more low risk trades with less time exposure to volatile, uncertain markets...

12/02/2014...REVERSALS RULE !

11/25/2014...Clear signals - not so clear
Some days good signals show on the longer time frames that are not so clear on the shorter...

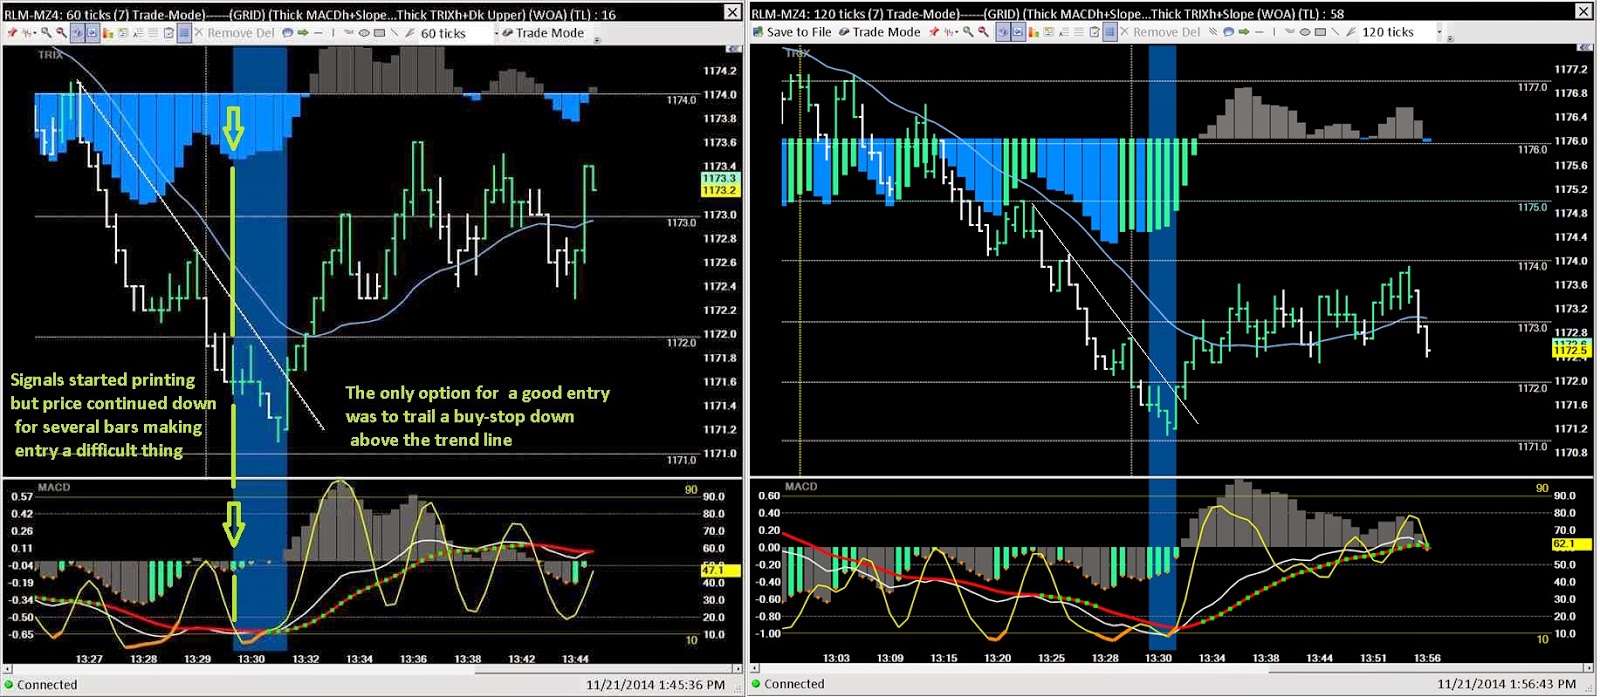
11/21/2014...It's not easy
There are times when good signals are firing but price doesn't cooperate...like there's a delayed reaction...
11/20/2014...One that got away
Missed getting a fill by less than a second...just half a click away...

Shoulda seen the one that came after the One that got away...
(but there's always another trade...)

11/16/2014...Night and Day

11/16/2014...Testing a new colorization template
A three Time Frame look at Histogram Slope...60T, 90T and 120T. The idea was to help the histo divergences stand out.
Also created a 10 point grid for getting a "feel" for the running ranges after reversals take place.

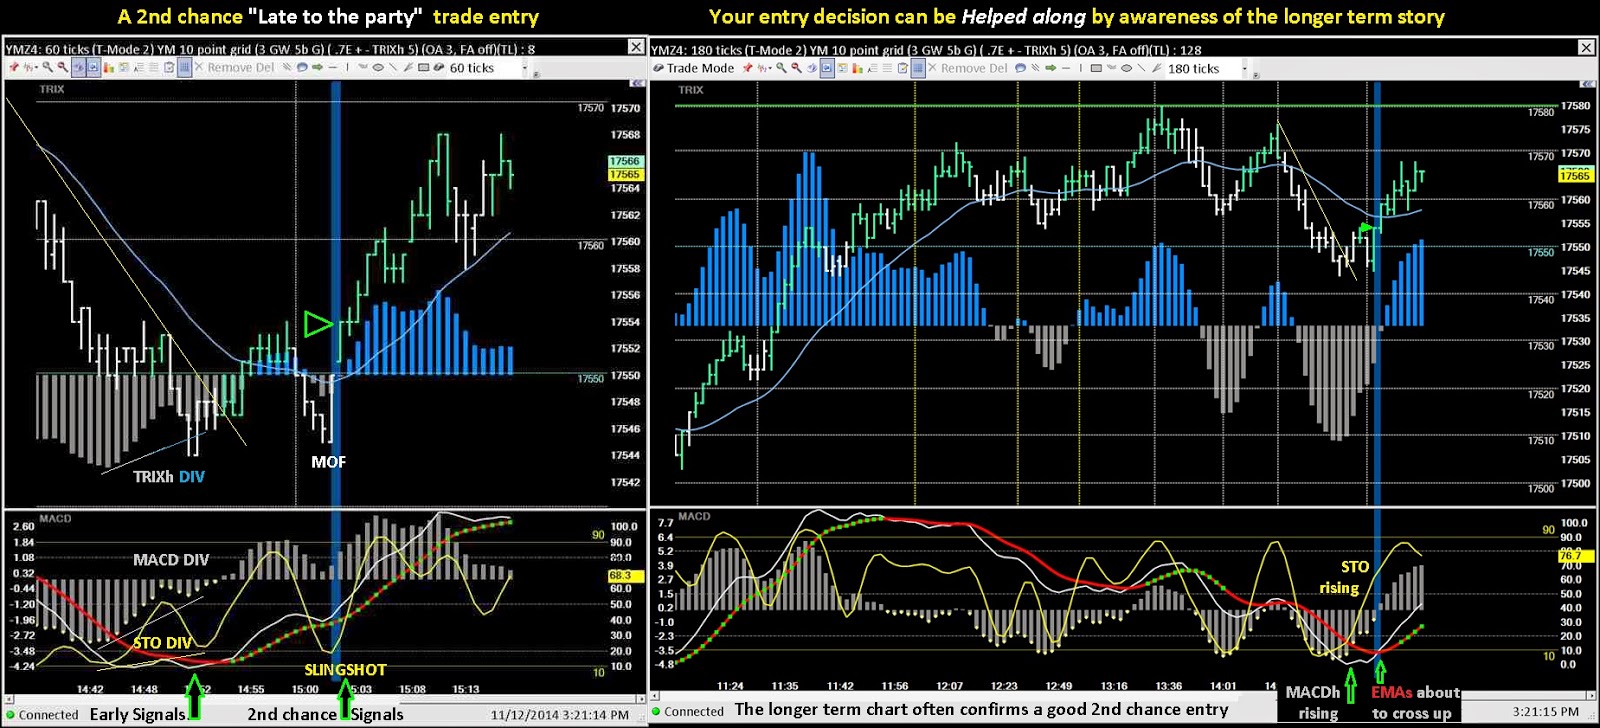
11/12/2014...More 2nd chance examples
The power of Money-on-the-Floor patterns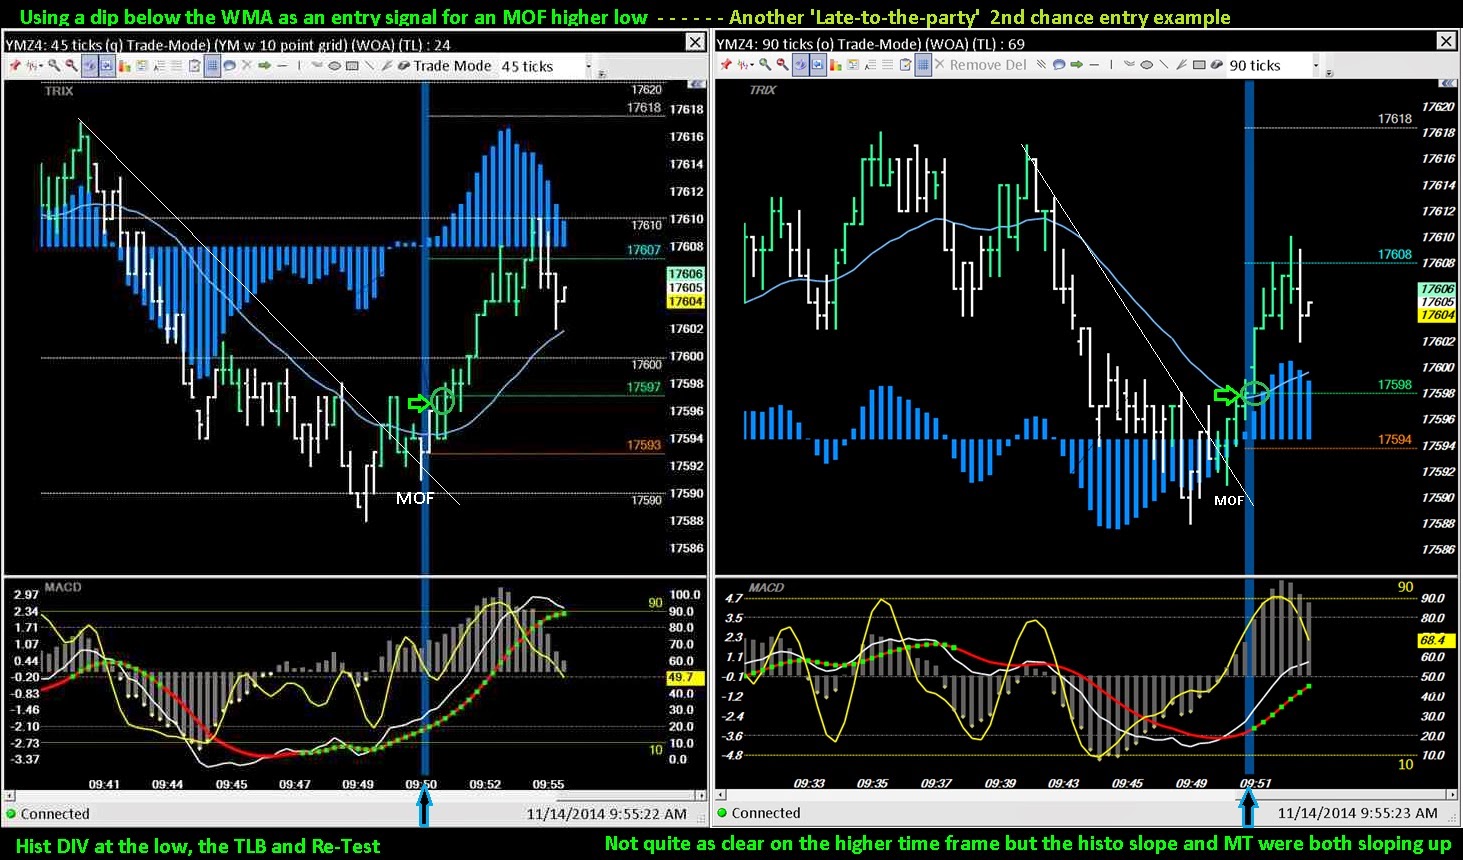
11/12/2014...NR7 pattern
A Narrow Range 7 pattern may have announced the top...will be interesting if does.
Long tailed spinners marking October's bottom to an NR7 with wedges and flags, perhaps marking a reversal...

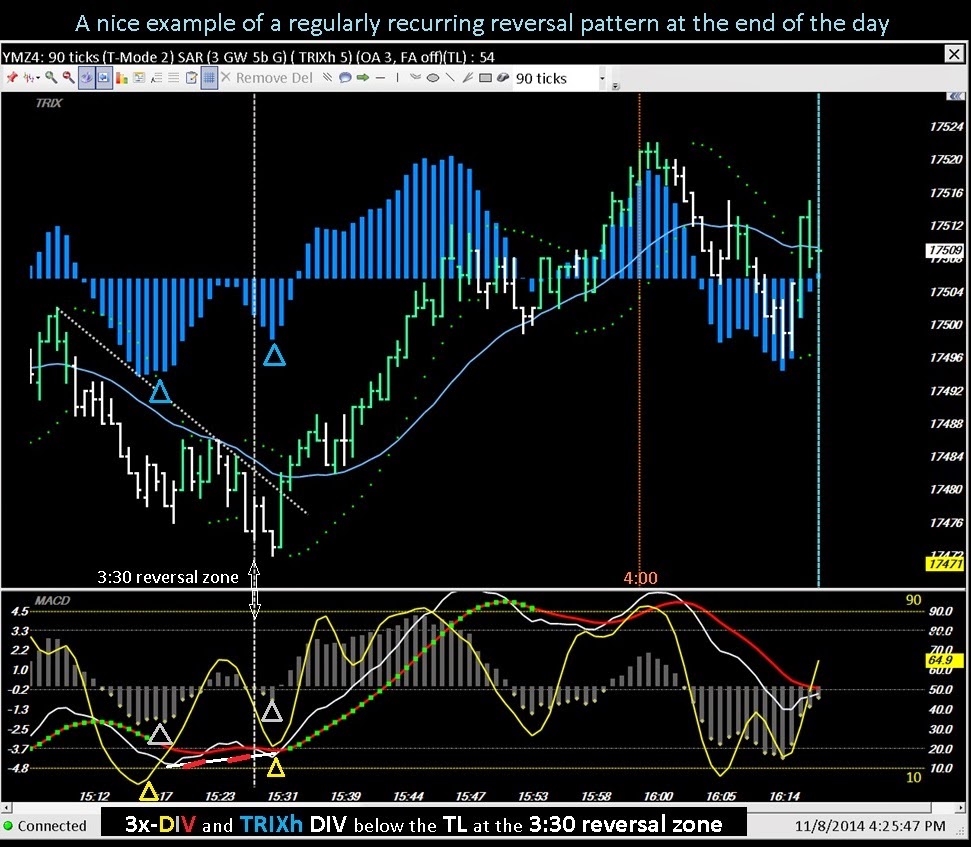
11/08/2014...3:30 Reversal Zone
Traders start to clean up their positions before the majors close...
10/30/2014...Patterns and Time
7:00 AM...A cup & handle on the RUT chart suggests continuation of the up trend.

9:30 AM...Patterns sometimes work as anticipated...

9:36 AM...But you also need to be nimble with the FUTs...
especially with the RUT... and most especially when the major markets open...
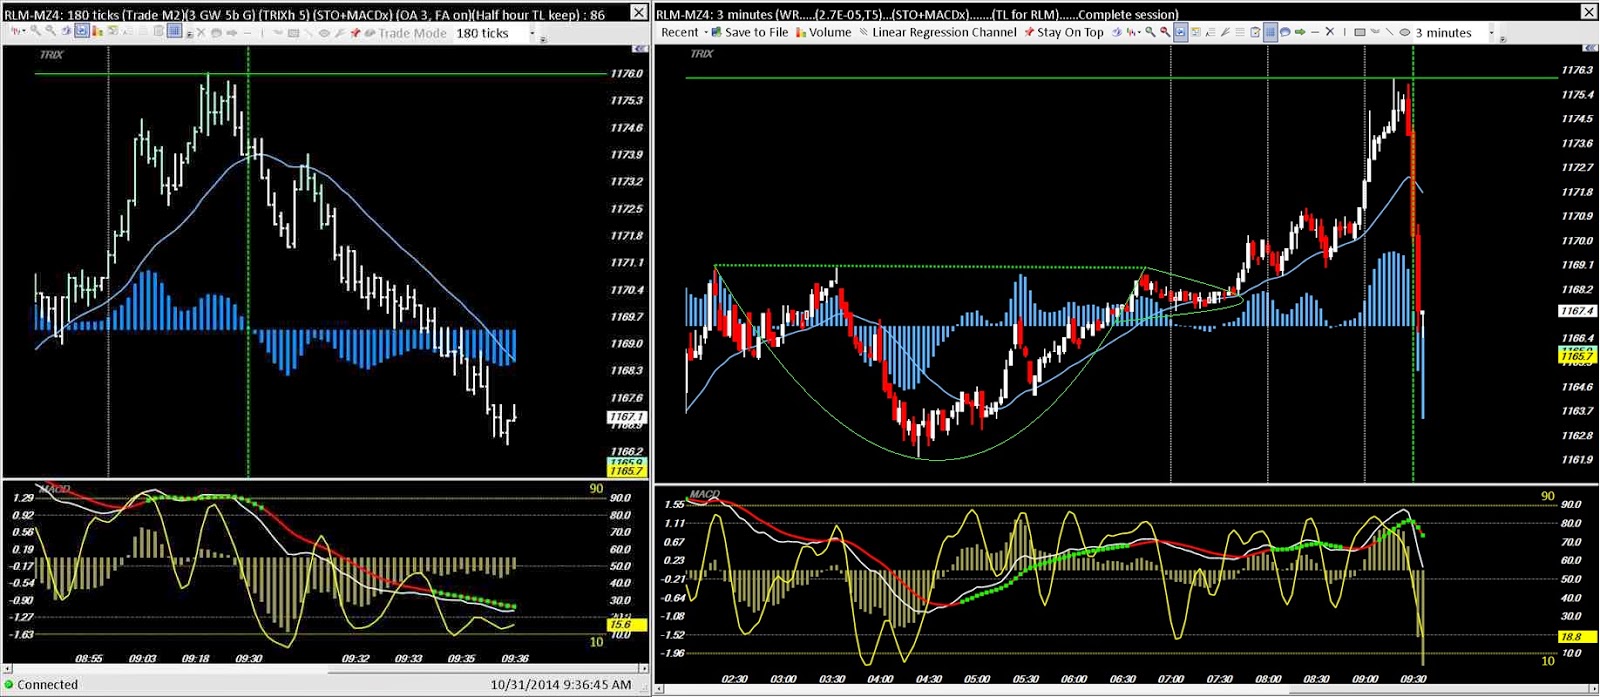
10/30/2014...Eating the Bear for breakfast
When is enough, enough? Always a difficult question...
Comparing chart sets - 75 ticks-per-bar vs 3 minute-per-bar of a divergence signaled reversal
and the extended run that followed

Nice little $340 run...

Nice little $550 run...

And it still wasn't done...ran up to a new session high after the majors opened.
Nice little $1380+ run...and done

10/29/2014...Price Action and TLBs
Remember them?
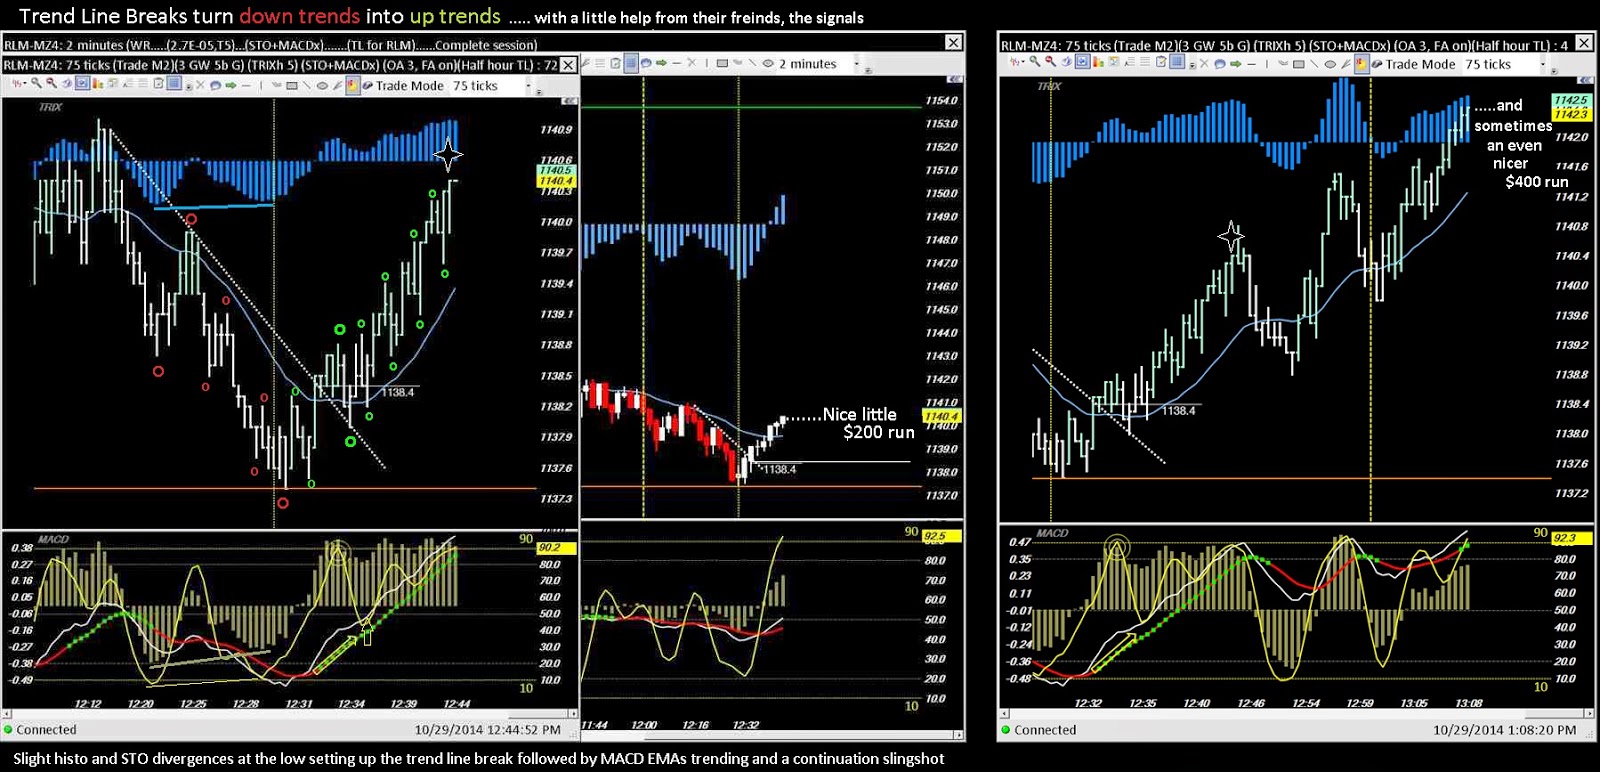
10/23/2014...Short stuff

10/18/2014...$12,000 per hour...
One contract at a time
...(2B - Dragon double bottom)...(SLING - stochastic was hooking out of over-sold, setting up a Slingshot)...(MT - MACD EMA lines were divergent and trending UP).....ALL these SIGNALs printed before price broke the trend line")
10/15/2014...Signals and Results
Signal comparison across time frames :

and the results :

You just never know how much of a run to expect from good signals...so take the money and run...

10/14/2014...Time based charts
Added a time based chart to my template list...The chart is sized so that at the end of the trading day
a 3 minute time frame will show the major market open thru the close...
It is set up to display vertical Time Lines for every 1/2 hour (from 9:30 AM to 5:15 PM)

In the layout it shares space with one of my trading tick charts and about half the session will be visible.
This chart serves a few different purposes than the longer term tick chart I had been using...
Time based charts will show Volume and On balance Volume indicators better than tick charts.
Plus it makes having to adjust the chart's Tick-Per-Bar unnecessary when changing to a different market.

10/09/2014...Pay Attention
Details, details, details...was down trending heavily all day, reversing yesterday's big gains and more
but then opportunity showed up !!! I was was snoozing, asleep at the wheel...

Take advantage of longer term time frames to increase your odds of a good entry and a successful trade.

10/07/2014...Hit & Run and Stone Drops
These next two chart sets illustrate why I use bracket stop orders (a stop-loss below entry and a target stop above).
Often price just drops like a stone after a small upward blip, so take the money and run.

This next picture shows the stone-drop after the target in the above trade was triggered.
The rectangular callout drawn on the right shows the run that the continuation trade (above) was based on.

Price does not always behave this way - you may miss out on a nice runner if it doesn't.
But I usually keep my target stop alone until I have some $$$ banked on the day.
Doing so gives me a buffer against later stop-outs while I develop my price action 'feel' for the current session.
Only after I see that price seems to be consistently running past my targets will I raise my target-stop
along with my sell-stop...hopefully allowing me to capture more per trade.
10/03/2014 Reminders...
There will be strings of days where it seems that there are few signals...or signals that fail to produce good price runs.
This happens most frequently when markets have been strongly down trending for a few days.
Eventually there's a longer term reversal and good signals begin to precede excellent runs once again.

You cannot capture them all...

09/26/2014 Things happen...
Repeating patterns and signals are an everyday occurrence...sometimes with an added twist...
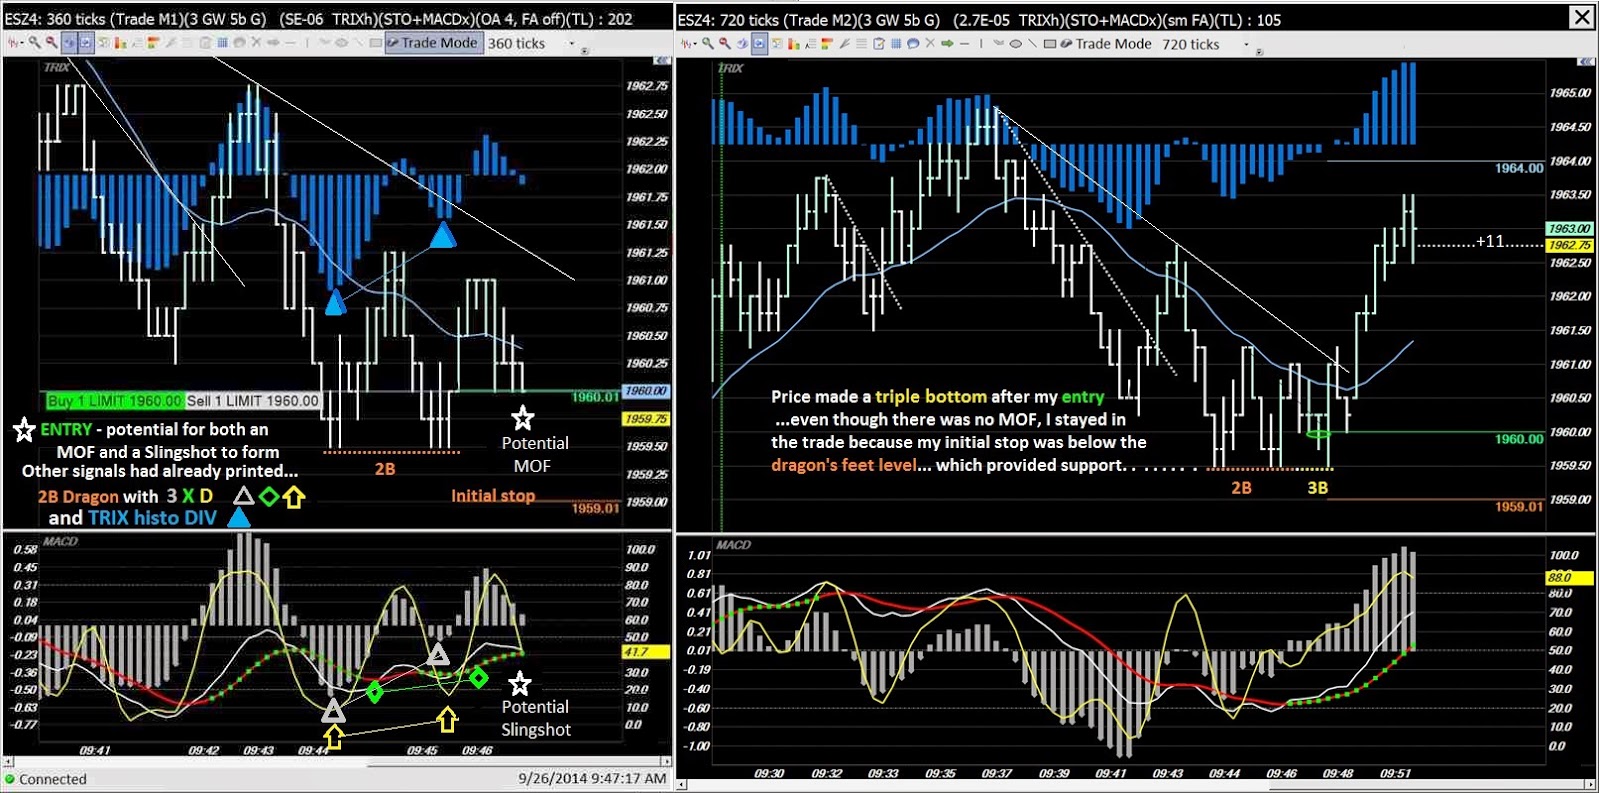
Same chart as above without all the annotations...can you spot the signals?

09/24/2014 Candlestick patterns
I don't follow most of the more arcane candlestick patterns but there are some I find useful
when viewing my longer term, non-trading charts...I pay attention to Hammers, long tailed doji, spinners and Harami.
Here's a couple of sets of dailies and multi-session charts that just happened to catch Harami patterns
that worked very nicely overnight through the major market close...


Combined session and daily charts with the sessions showing the previous few day's
downward price action and the reversals after Tuesday night's Harami...


09/19/2014 Pre-MMO Pace
Markets are much slower paced before the majors open at 9:30...
This trade was placed at 8:14 and took 15 minutes to capture 10 ticks...
I had my order brackets set for a 4 tick stop-loss and 10 tick target stop.

As shown below, even though a lot was left on the table, you just never know for sure when they'll run.
By 8:54 price had continued up to 17253 with no more than a 5 tick pull-back...

09/16/2014...Gut feeling
Take some chances when you have already had a good day...

09/02/2014...Reminder
Good signals across multiple time frames do not automatically guarantee a winner...

8/24/2014 ... Trending Bars ... template mods
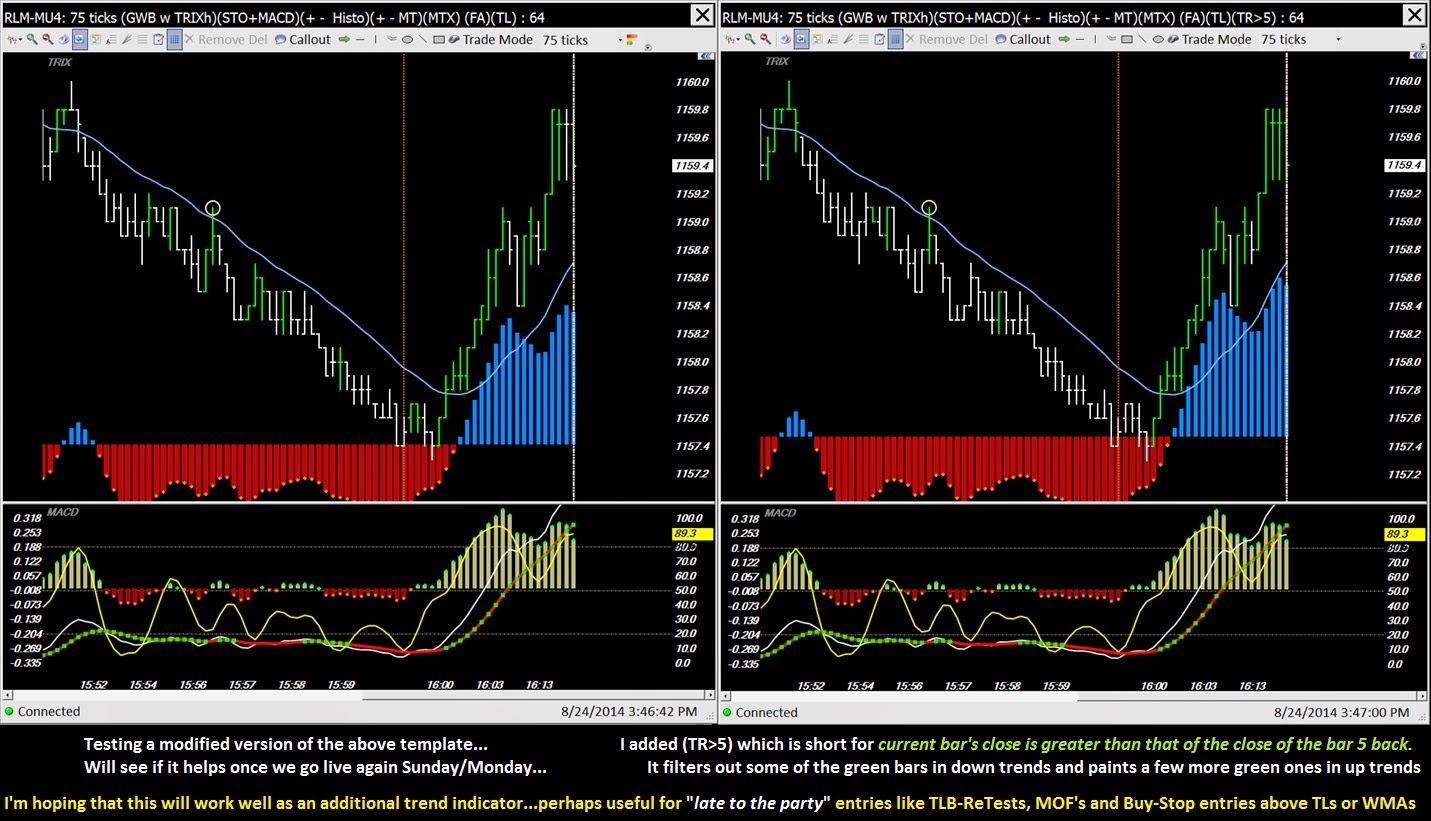
Will also test (TR>4), (TR>3) and (TR>2)...the current template paints the bars based
on whether the current bar's close is greater than the previous one...
The Coloring Indicator is not 'perfect' because some down bars get painted green anyway.
8/27/2014 An example with (TR>5) applied to price...also showing using the WMA for setting trailing stops.

8/22/2014 ... MACD EMA Crosses
The following four charts illustrate both Bearish crosses and Bullish crosses on three different time frame trade charts...
and the results that were possible using just the crosses as trade entry rational.
Back-to-back sets - short @ 10:15, cover @ 10:18 ... buy @ 10:23, sell @ 10:32
Sell short

Cover

Buy - entry

Sell - exit

Trading MT and MTX 'marginal' signals
You've got to ask yourself the question...do you feel lucky?

8/22/2014 ... A reminder

8/15/2014 MACD X indicator
Testing a custom "Show Case" indicator on my trade charts, added it to the faster MACD EMA trigger line.
It prints a little differently relative to the similar MT indicator I use on the TRIX and MACD histograms.
It will start a bit later than MT sometimes but it will keep printing above the EMA's centerline as the trend continues.
The idea is not to use it so much as an entry signal...but to use it to help decide whether to stay
with an existing position longer...i.e. a "runner trade" indication signal.

Below I've applied the MACD X indicator to the MACD EMA signal line.
It's easier to see - perhaps it will highlight a continuing trend with more definition...Actual crossings of the contrasting
white trigger and red signal lines are easily enough seen anyway. The green dots stand out much better
on the signal EMA, in effect changing the color from red down trends to green up trends.

A more colorful look at what can be done with "Custom Indicators"...

Using MACD X to stay in a position longer...sometimes you can capture most of a runner trend.

Another runner shortly after the one shown above...

8/14/2014 KISS
Price action is the key to successful counter trend reversal trading...

7/30/2014 Low Risk Entries
Examples showing how to participate without the need for perfect timing...don't chase prices, let them come to you.
The blue vertical lines and green ovals identify two trade entry possibilities...
The one on the left hand side will keep you out in case the signals or patterns fail to materialize, the one on the right
may allow you to participate even though you missed the earlier signals.

Although every trade day is different, note that these two trade opportunities occurred within 15 minutes of each other...
This is not an uncommon happenstance.
Short term counter trend long entry signals fire off continually, nearly every day. Your potential gains are limited only
by how often you care to trade and how long you can concentrate on the squiggly lines on a chart.
7/29/2014 P/A patterns
Here's an example of sets of patterns and signals that often occur back-to-back...
Trailing a buy-stop down will keep you out in the event that the signals fail
yet will get you into a position to take advantage of the reversal as price continues to move up.

7/24/2014 'Price Explosion'
Sometimes good signals fire but they are difficult to react to...In this case, anticipating a TLB by trailing a buy-stop down
above the TL and above the current bar is the best way to participate...
Could use a market order on the breakout but you never know where your entry will be filled...

7/15/2014 How Reversals are Made
PA...TLB...RE-Test...MT...MOF...SLING
Price made a new HH just below the Major trend line after breaking the minor trend line... The TLB Re-Test and MOF
turned out to be the 1st HL of the reversal.
the potential reversal that the 3xD signals were broadcasting...Then trailing a buy-stop order down above the flattening WMA
after the new HH printed was a good way to anticipate the potential continuation of a new up trend
that the TLB-RETEST, the MT and MOF signals were broadcasting...
And even later than that, a trailing a buy-stop down, just above the Major TL also provided for a good entry...
Any or all three entry orders would have kept you out of a losing trade if the events/signals failed to produce...
7/10/2014 MACD TREND
I am liking how often the MT gives a heads up when other signals may not be present...
Trailing a buy-stop entry order above the WMA plays well...


7/7/2014 MACD TREND
A "Late to the party" entry using MACD TREND (MT) as the primary signal...
After a TLB and a new high prints, price often retraces back to re-test the area where it broke the trend line.
Use the WMA as it's flattening and/or 'curling' up as the starting point to trail a Buy-Stop order down.
The idea being : capture an up move if it comes yet stay out in case price just continues down.
This example had no great signals at or below the trend line break point but later, at the vertical green line
the MACD EMAs could easily be seen to be trending up...
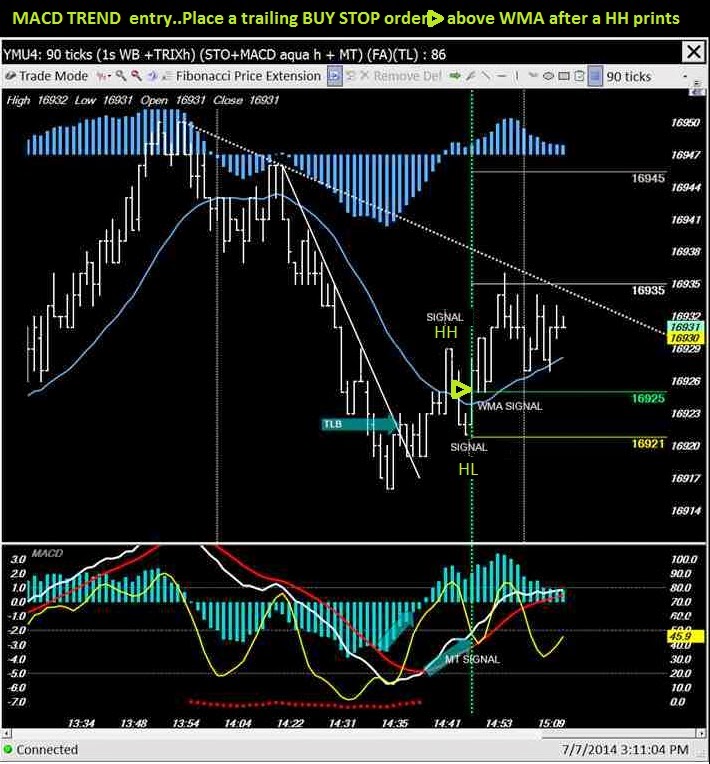
As in the example above, note that a HL MOF will often form near the TLB Re-Test area...
Also, slingshots often develop with an MOF...but MOFs and slingshots are usually very difficult to see until after price
makes it's move...thus your chance to make a good entry may get missed...
That's when MT and the WMA can help you anticipate the forming of those other signals.
7/8/2014 Below: all the elements for a good " late to the party" trade, using MT and the WMA...
 Another MT example:

7/3/2014
A shortened session today ahead of the 4th of July holiday but opportunities were still available.
Was watching multiple time frames but missed the signals shown on the shorter time frame.

7/02/2014
A conflict in patterns at the end of yesterday's session...showing only on the RUT, not on the YM, ES or NQ.
Posted 8:30 AM

The H&S minimum move would erase all of yesterday's gain. The divergences have formed under the TL
which suggests a pop (but it may have already happened) ...
The STO has the potential for a SLING to help propel prices up if the trend line gets busted...
11:20 AM update - Price Action rules the movement...

7/01/2014
Testing a different chart set up and a 'new' MACD TREND indicator
(red line at the bottom of the study when the MACD histo is below the zero line)
Too bad I wasn't watching when the signals were firing...missed out on +10 ticks per contract

6/30/2014
It seems like I've seen this a thousand times but I'm still not ready to use it on it's own as a late entry signal...
(I missed the good 3xD that printed before the TLB)

6/26/2014
Sometimes you eat the bear...
 As of late, there have been quite a few good trades available in the pre-major-market-open time area.
6/25/2014
Early morning coincidences? Signals on three time frames = a good trade...

6/23/2014
Why bother watching multiple charts of differing time frames ?
 Trailing a BUY-STOP for entry in anticipation of signals forming...
 What the next 2 higher time frames looked like on the trade described above...

6/20/2014
Nice pre-market Price Action Signals in the RUT
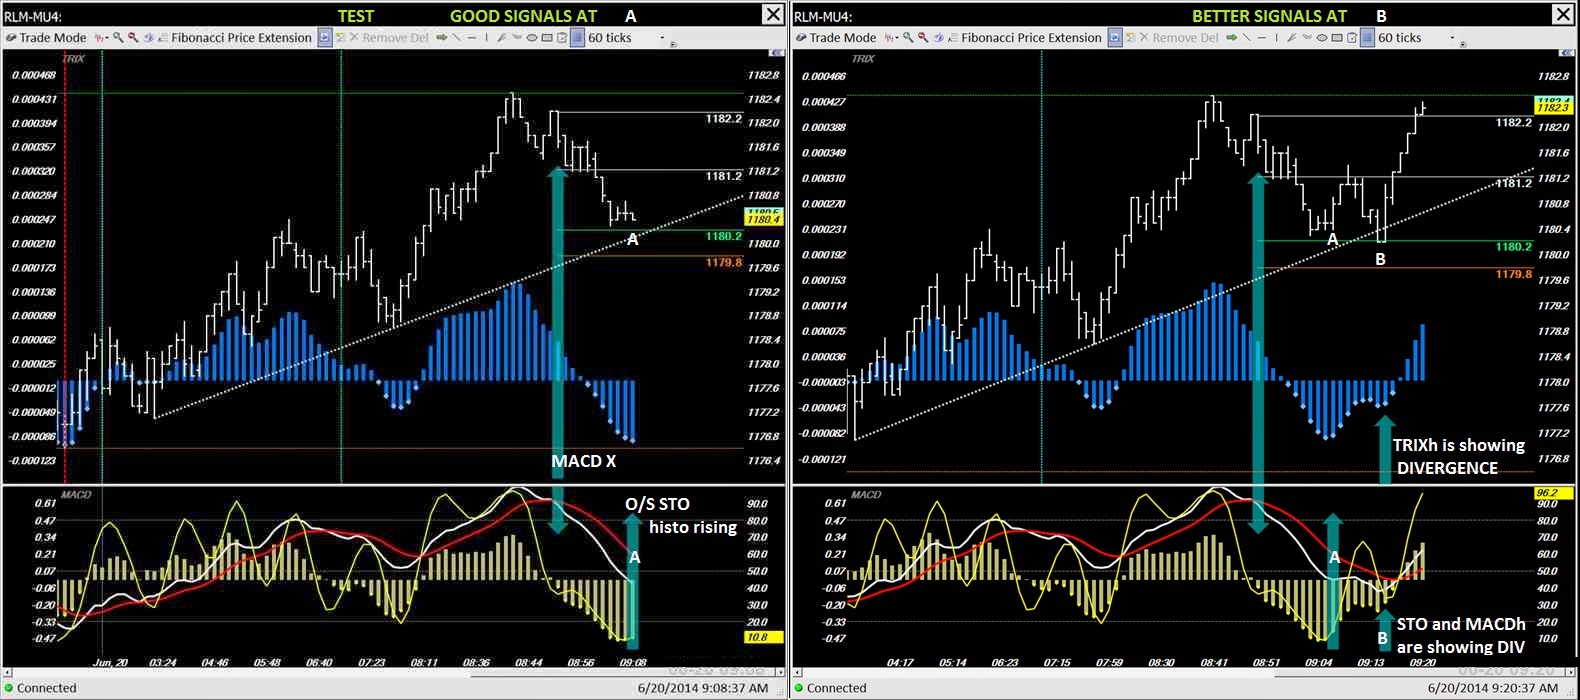 TLB Re-Test MOF

6/18/2014
The past few days have been producing few 'good' trade opportunities with a sparse number of Signals printing
or printing Signals that FAIL ... This set up had everything going for it : a 2B with 3xD - histos, MACD EMAs and stochastic.
But it only ran up +7 from the TLB...With the YM, it "should" run at least 10 points.
 The Signals FAILED...or did they?
 Fat finger FED fudging

An afterhours TEST TRADE...
Another advantage of using TICK charts vs time based...Signals are not dependent on time - only on P/A

6/15/2014
Practice or TEST trades...Practice makes perfect
I need constant reminders to keep from over-trading which often results in poor choices
and too many stop-outs. The next two chart sets show some of the reasons why I take so many chart snapshots...
TEST Trade set A...This set illustrates why I should wait for good signals.

TEST Trade set B compared to TEST Trade set A above - Just 12 minutes later...
WAITING FOR GOOD SIGNALS = GOOD RESULTS
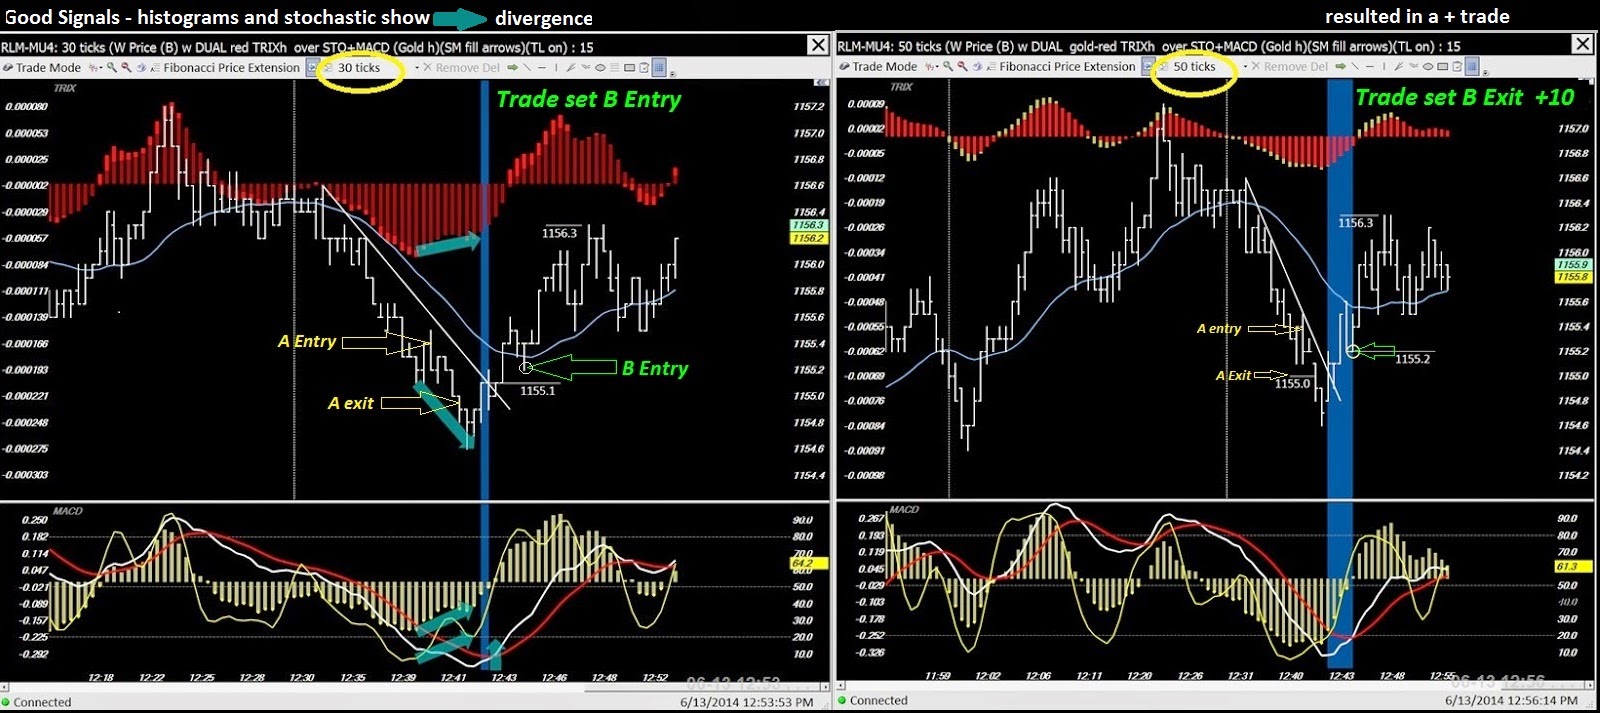
6/13/2014
Practice trades...thoughts...this was in the early morning, just after the 7:00 AM reversal area...price had just come off
of a new session low...morning markets are much slower paced and seem to run further after signals fire.
This practice trade has given me the idea to increase my initial bracket target stop to 15 (from my normal 10)
for trading the YM in the pre-major market time zone...(leaving the stop loss at 4)
 A successful early morning "slow paced" trade in the RLM...lasting 20 minutes.

6/10/2014
I continue to add notes on my charts to explain "How I do it".
Summaries of the "rationalizations" for entry that are added to charts helps to reinforce the good set ups to the subconscious...
Rationals are slightly different than reasons...IMO, reasons denote facts or universal truths...
But in the continually changing market environment, one day's rational may not work the next day.
(which is a good reason to use stop-loss orders)

6/06/2014
TEST TRADES
To get a feel for the current Price Action, the reliability of the Signals that are firing off and the type of trades/entries
that may or may not be working, I find it helpful to do practice or TEST trades throughout the day...
Doing this is especially helpful during the pre-major-market open times, before making any actual trades.
Taking a snapshot and adding annotations is useful to reinforce in the mind's eye what I think is occurring.
This often will reduce the number of stop-outs I take...
 TEST TRADES like the one in the snapshot above can tell you several things :
1)...Is price reacting to a TLB by shooting up without a re-test?
(perhaps using a market order to enter will work best)
2)..............Are the signals firing but then failing to follow thru?
(perhaps a trailing stop above the TL will keep you out, saving stop-losses)
3)................Is price re-testing the TLB area before taking off?
(perhaps a limit order at the TLB will yield the best results)
4)................Are signals firing but failing or are signals sparse?
(perhaps avoid initiating trades will work best, until the situation changes)
6/05/2014
Signals work before the majors open...in the same manor they do after the majors open...
A Continuation Slingshot in an up trend...in and out in 5 minutes
90 tick trade chart
 Other signals - Note the Reverse Divergence in both histograms - While price was making a higher low
the histos were making lower lows which indicates to me that the pull back was OVER-DONE.
Note: The 'Exit' chart on the right hand side shows stochastic still rising...it looks like price would have continued up
allowing completion of the slingshot, which was mentioned as a rational for taking the trade in the first place...
I often raise my stop loss and/or my target brackets as price rises, in an attempt to squeeze more out of a trade...
BUT not always...this is just another example of Discretionary Trading.
The chart below shows what a 'perfect' continuation slingshot looks like after the fact...
120 tick chart

Below - the same 120 tick chart along with a longer term perspective of this continuation slingshot.
The green oval and vertical dots depict the entry area (see the 90 tick chart). The yellow square shows the exit...
Obviously a lot was left on the table. But I don't sweat about how much more I "coulda-shoulda-woulda" made.
There is always another trade

6/3/2014
Price Action and Signals work before the majors open...in the same way they do after the majors open...
The action is usually just a little slower giving you more time to react.
This example was from around 8:00 AM in the morning.

5/23/2014
Basic bread-and-butter signals incorporating Trend Lines and Price Action.
Another look at some old familiar patterns that have been working perfectly over the past few sessions...


5/21/2014
A look at a couple of pre-market trades on multiple time frames...
You can see how much earlier the signals printed on the 30 tick vs. the 45 and 60 tick...
 A look at a standard 2xD divergence trade at the open...
 3 trades, up $300 per contract...so...done for the day?
5/19/2014
The trials and tribulations of a day trader... this series of charts shows what you are up against.
...not just the market but yourself...
MACD trend and Slingshots on 2 different time frames...watched this....
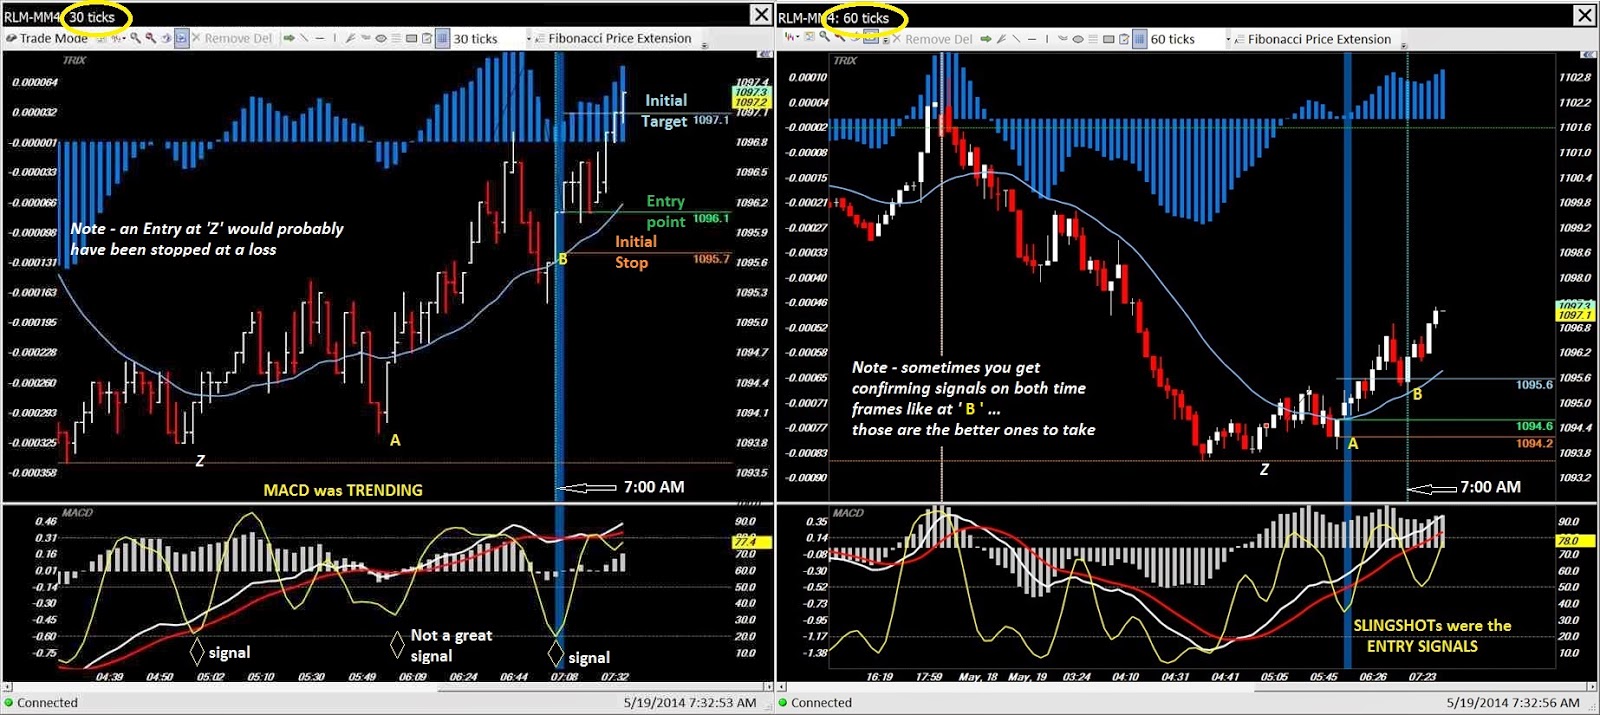 A little later - Conflicting signals on 2 different time frames....watched this....
 Just a little bit more time passed - decided to "GO"....
 Above - took +3 ticks out...Learn but don't second guess...
The markets are like a zoo
 Bulls and bears make money...are you a sceptical orangutan or a reactionary zebra?
05/09/2014
Experimenting with darker colors for the down histogram bars on both the TRIX and the Awe Osc.
In these examples ALL indicators printed divergence below the trend line...might start calling it 4xD.
 Same charts as those shown above but with fewer annotations...

05/7/2014
With the Awe Osc and the RUT, don't think - REACT !
Price explosions on reversals...
 20 minutes later another opportunity that probably would have been stopped out...see the long bar & AO change
that happened BEFORE the more "regular" 3xD divergence entry signals (MACDh+STO+MACD EMAs) highlighted by the blue vertical line.
Still gotta be nimble with the 3xD play but also notice the 'long' up bar and AO color change as well as its divergence...

Another trade opportunity into the major market close...

5/02/2014
Still developing 'feel' for the relationships between Price Action, MACDh and the Awesome Oscillator...
These are both pictures of the same 60 tick-per-bar chart - notice that less than 5 minutes transpired
between the bars marked A & B and the two reversals seen afterwards on the RH chart. In this case - it was
a very fast market when viewing a 60 tick chart...but going to 90t or 120t may not show an entry point or as good a risk/reward possibility.

5/01/2014
Lunch time SIGNALs...both worked...one better than the other...
 What the above looked like - Same ticks-per-bar with more bars...

4/30/2014
At this point I'm not trading this - want to see the pattern more times to build my confidence but it does show some promise...
This is a bit outside my 'norm' of using indicator divergences as reversal signals, yet it does have the element of trend line breaks to it...
.jpg)
4/28/2014
Started testing the Awesome Oscillator today as a histogram in the price pane.
Its very 'smooth' and often works similarly as my more normal TRIX histo with price but there are some subtle differences.
Sometimes good signals fire but they are difficult to react to...In this case, anticipating a TLB by trailing a buy-stop down
above the TL and above the current bar is the best way to participate...
Could use a market order on the breakout but you never know where your entry will be filled...

7/15/2014 How Reversals are Made
PA...TLB...RE-Test...MT...MOF...SLING

turned out to be the 1st HL of the reversal.
"Late to the party entries"
I find it interesting that trailing a buy-stop order down above the Minor Trend Line was a good way to anticipatethe potential reversal that the 3xD signals were broadcasting...Then trailing a buy-stop order down above the flattening WMA
after the new HH printed was a good way to anticipate the potential continuation of a new up trend
that the TLB-RETEST, the MT and MOF signals were broadcasting...
And even later than that, a trailing a buy-stop down, just above the Major TL also provided for a good entry...
Any or all three entry orders would have kept you out of a losing trade if the events/signals failed to produce...
7/10/2014 MACD TREND
I am liking how often the MT gives a heads up when other signals may not be present...
Trailing a buy-stop entry order above the WMA plays well...

Some additional observations and caveats on MT

7/7/2014 MACD TREND
A "Late to the party" entry using MACD TREND (MT) as the primary signal...
After a TLB and a new high prints, price often retraces back to re-test the area where it broke the trend line.
Use the WMA as it's flattening and/or 'curling' up as the starting point to trail a Buy-Stop order down.
The idea being : capture an up move if it comes yet stay out in case price just continues down.
This example had no great signals at or below the trend line break point but later, at the vertical green line
the MACD EMAs could easily be seen to be trending up...

As in the example above, note that a HL MOF will often form near the TLB Re-Test area...
Also, slingshots often develop with an MOF...but MOFs and slingshots are usually very difficult to see until after price
makes it's move...thus your chance to make a good entry may get missed...
That's when MT and the WMA can help you anticipate the forming of those other signals.
7/8/2014 Below: all the elements for a good " late to the party" trade, using MT and the WMA...


7/3/2014
A shortened session today ahead of the 4th of July holiday but opportunities were still available.
Was watching multiple time frames but missed the signals shown on the shorter time frame.

7/02/2014
A conflict in patterns at the end of yesterday's session...showing only on the RUT, not on the YM, ES or NQ.
Posted 8:30 AM

The H&S minimum move would erase all of yesterday's gain. The divergences have formed under the TL
which suggests a pop (but it may have already happened) ...
The STO has the potential for a SLING to help propel prices up if the trend line gets busted...
11:20 AM update - Price Action rules the movement...

7/01/2014
Testing a different chart set up and a 'new' MACD TREND indicator
(red line at the bottom of the study when the MACD histo is below the zero line)
Too bad I wasn't watching when the signals were firing...missed out on +10 ticks per contract

6/30/2014
It seems like I've seen this a thousand times but I'm still not ready to use it on it's own as a late entry signal...
(I missed the good 3xD that printed before the TLB)

6/26/2014
Sometimes you eat the bear...

6/25/2014
Early morning coincidences? Signals on three time frames = a good trade...

6/23/2014
Why bother watching multiple charts of differing time frames ?


6/20/2014
Nice pre-market Price Action Signals in the RUT


6/18/2014
The past few days have been producing few 'good' trade opportunities with a sparse number of Signals printing
or printing Signals that FAIL ... This set up had everything going for it : a 2B with 3xD - histos, MACD EMAs and stochastic.
But it only ran up +7 from the TLB...With the YM, it "should" run at least 10 points.


Another advantage of using TICK charts vs time based...Signals are not dependent on time - only on P/A

6/15/2014
Practice or TEST trades...Practice makes perfect
I need constant reminders to keep from over-trading which often results in poor choices
and too many stop-outs. The next two chart sets show some of the reasons why I take so many chart snapshots...
TEST Trade set A...This set illustrates why I should wait for good signals.
WAITING FOR GOOD SIGNALS = GOOD RESULTS

6/13/2014
Practice trades...thoughts...this was in the early morning, just after the 7:00 AM reversal area...price had just come off
of a new session low...morning markets are much slower paced and seem to run further after signals fire.
This practice trade has given me the idea to increase my initial bracket target stop to 15 (from my normal 10)
for trading the YM in the pre-major market time zone...(leaving the stop loss at 4)


6/10/2014
I continue to add notes on my charts to explain "How I do it".
Summaries of the "rationalizations" for entry that are added to charts helps to reinforce the good set ups to the subconscious...
Rationals are slightly different than reasons...IMO, reasons denote facts or universal truths...
But in the continually changing market environment, one day's rational may not work the next day.
(which is a good reason to use stop-loss orders)

6/06/2014
TEST TRADES
To get a feel for the current Price Action, the reliability of the Signals that are firing off and the type of trades/entries
that may or may not be working, I find it helpful to do practice or TEST trades throughout the day...
Doing this is especially helpful during the pre-major-market open times, before making any actual trades.
Taking a snapshot and adding annotations is useful to reinforce in the mind's eye what I think is occurring.
This often will reduce the number of stop-outs I take...

1)...Is price reacting to a TLB by shooting up without a re-test?
(perhaps using a market order to enter will work best)
2)..............Are the signals firing but then failing to follow thru?
(perhaps a trailing stop above the TL will keep you out, saving stop-losses)
3)................Is price re-testing the TLB area before taking off?
(perhaps a limit order at the TLB will yield the best results)
4)................Are signals firing but failing or are signals sparse?
(perhaps avoid initiating trades will work best, until the situation changes)
6/05/2014
Signals work before the majors open...in the same manor they do after the majors open...
A Continuation Slingshot in an up trend...in and out in 5 minutes
90 tick trade chart

the histos were making lower lows which indicates to me that the pull back was OVER-DONE.
Note: The 'Exit' chart on the right hand side shows stochastic still rising...it looks like price would have continued up
allowing completion of the slingshot, which was mentioned as a rational for taking the trade in the first place...
I often raise my stop loss and/or my target brackets as price rises, in an attempt to squeeze more out of a trade...
BUT not always...this is just another example of Discretionary Trading.
The chart below shows what a 'perfect' continuation slingshot looks like after the fact...
120 tick chart

Below - the same 120 tick chart along with a longer term perspective of this continuation slingshot.
The green oval and vertical dots depict the entry area (see the 90 tick chart). The yellow square shows the exit...
Obviously a lot was left on the table. But I don't sweat about how much more I "coulda-shoulda-woulda" made.
There is always another trade

6/3/2014
Price Action and Signals work before the majors open...in the same way they do after the majors open...
The action is usually just a little slower giving you more time to react.
This example was from around 8:00 AM in the morning.

5/23/2014
Basic bread-and-butter signals incorporating Trend Lines and Price Action.
Another look at some old familiar patterns that have been working perfectly over the past few sessions...

5/21/2014
A look at a couple of pre-market trades on multiple time frames...
You can see how much earlier the signals printed on the 30 tick vs. the 45 and 60 tick...


5/19/2014
The trials and tribulations of a day trader... this series of charts shows what you are up against.
...not just the market but yourself...
MACD trend and Slingshots on 2 different time frames...watched this....


The markets are like a zoo

05/09/2014
Experimenting with darker colors for the down histogram bars on both the TRIX and the Awe Osc.
In these examples ALL indicators printed divergence below the trend line...might start calling it 4xD.

05/7/2014
With the Awe Osc and the RUT, don't think - REACT !
Price explosions on reversals...

that happened BEFORE the more "regular" 3xD divergence entry signals (MACDh+STO+MACD EMAs) highlighted by the blue vertical line.
Still gotta be nimble with the 3xD play but also notice the 'long' up bar and AO color change as well as its divergence...


5/02/2014
Still developing 'feel' for the relationships between Price Action, MACDh and the Awesome Oscillator...
These are both pictures of the same 60 tick-per-bar chart - notice that less than 5 minutes transpired
between the bars marked A & B and the two reversals seen afterwards on the RH chart. In this case - it was
a very fast market when viewing a 60 tick chart...but going to 90t or 120t may not show an entry point or as good a risk/reward possibility.

5/01/2014
Lunch time SIGNALs...both worked...one better than the other...


4/30/2014
At this point I'm not trading this - want to see the pattern more times to build my confidence but it does show some promise...
This is a bit outside my 'norm' of using indicator divergences as reversal signals, yet it does have the element of trend line breaks to it...
.jpg)
Started testing the Awesome Oscillator today as a histogram in the price pane.
Its very 'smooth' and often works similarly as my more normal TRIX histo with price but there are some subtle differences.
